
Page 29 - Summer 2018
P. 29
(a)
Mines, Torpedoes,
and Countermeasures
Underwater sound radiated from a ship consists mainly of engine and propeller noise, which can easily be detected by hydrophones and used to trigger acoustic mines. Acoustic mines were first deployed by the Germans around the Brit- ish Isles in 1940 (Moffatt, 2005). Consequently, acoustic minesweeping devices were developed to trigger the mines from a safe standoff distance; essentially, these were very loud noisemakers. One widely used type was the “paral- lel-pipe” noisemaker that was developed by trial and er- ror in naval dockyards in the United States and Canada. It consisted of two 6-foot (1.88-m)-long pipes connected by a bridle and towed in the wake of a minesweeper oriented at right angles to the flow of water (Longard, 1993). The vorti- ces produced between the pipes as they struck one another repeatedly resulted in broadband noise.
During the course of the war, the two magnetic ranges in Halifax Harbour were outfitted with hydrophones, filters, and recording equipment. Based on intelligence reports, the initial frequency bands of interest were 170-340 Hz for Ger- man acoustic mines and 20 kHz for German wake-homing torpedoes. Eventually, the Hugonin Range was equipped to cover frequencies from fractions of a hertz to 256 kHz (Longard, 1993). The frequency bands were referred to by their British Admiralty-style abbreviations of FL (low fre- quency: 1-100 Hz) and FH (high frequency: 8-200 kHz) and what the NRE called F0 (the pressure wave induced by the passage of a ship).
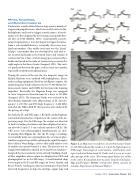
For both the FL and FH ranges, a Rochelle salt hydrophone was bottom mounted on a tripod near the center of the de- gaussing range. For the FH range, the output was directed to banks of analog electronics and then displayed on an ar- ray of twelve 3-inch (7.5-cm) cathode ray tubes (CRTs). The CRT traces were photographed simultaneously on slow- ly moving film (Figure 2a). For the FL range, recordings were initially made on a gramophone disc of wax on glass. Analysis required repeatedly replaying the signal through a filter called a Wien Bridge, a device that could only be used to analyze one narrow band at a time. The process was so fraught with difficulties that Ed Lewis and Oscar Sandoz re- designed the measurement system entirely, building a bank of filter amplifiers whose output was displayed on CRTs and photographed (as in the FH range). Several hundred ships were ranged at the FL and FH ranges by Lewis, Sandoz, and Bruce French, resulting in statistical summaries that related observed frequencies to ship size and type, engine type, and
(b)
Figure 2. a: Ship noise recorded on 12 one-third octave bands (8-128 kHz indicated by numbers 3-14) at the high-frequency (FH) range. Traces begin at x and end at y, with the bow-stern aspect indicated below band 13. Peaks tend to occur at or just after passage of the stern. The timing signal dashes are visible in the center. b: Canadian Anti-Acoustic Torpedo (CAT) gear. Top: parallel pipes; bottom: towing lines. Photo courtesy of Canada, Department of National Defence.
Summer 2018 | Acoustics Today | 27
