
Welcome to the second installment of “The World Through Sound,” the Acoustics Today web series that shows how understanding just a few concepts in acoustics can change the way you see the world around you. Last time, we considered sound speed, and how sound speed mediates the mechanical interactions of our daily lives. In this article, we will consider the ubiquitous concept of frequency, and how the relationship between time and frequency can help understand one of the fundamental laws of quantum mechanics.
Heisenberg’s Uncertainty Principle is one of the most famous laws of quantum mechanics. Simply put, this law states that when measuring a quantum particle, like an electron, one cannot know both the position and momentum of the particle exactly. The more precisely you know the first quantity, the less precisely you know the second, and vice versa. Thus, if you know the position of the electron you cannot precisely know the particle’s momentum.
And while physicists of Heisenberg’s era may have found this revelation truly disheartening, the concept has been utterly liberating to science-fiction authors the world over who have leveraged this principle to justify any number of improbable scientific advances, up to and including time travel between diverging timelines and the faster than light travel of the Improbability Drive in The Hitchhiker’s Guide to the Galaxy. The uncertainty principle, however, is not limited to the tiniest particles in existence. The Heisenberg Uncertainty Principle holds true in any wave-like system, and is fundamental in acoustics since it is the principle that binds together the concepts of frequency and time.
Frequency is, at its core, a fancy word for “rate.” The number of times that a given event happens in a period of time is known at its frequency. For example, a metronome that taps at a rate of two taps per second (s) is said to have a frequency of 2 Hz (Hz being defined as 1/s). For sound, frequency is experienced as a unique dimension that is also called “pitch.” If one were to sing an ascending scale, such that each pitch was higher than the last, the frequency of each note would also increase with each successive note. For a healthy young person with average hearing, the range of frequencies that can be heard ranges from 20 Hz to 20,000 Hz, a span of nearly 10 octaves! Pressure waves below 20 Hz (often called infrasound) will often be felt more than heard, particularly as a sort of “throbbing” force, while waves above 20,000 Hz (frequently called ultrasonic) will be largely inaudible (though this may not be true for animals with hearing better tuned to receive those sounds, such as dolphins, dogs, and bats).
Because frequencies have to do with rates, the frequencies of sounds that we hear can tell us a lot about the underlying mechanical actions that generate them. The low frequency hum of an air conditioner comes from the rhythmic motion of the compressor and the rotation of the fan blade pushing the air. The high frequency squeak of a shoe sliding across tile comes from the rapid “stick and slip” motion as the rubber repeatedly overcomes its friction with the surface to move. Because of the difference in frequency, we can immediately tell that the “stick and slip” motion of the shoe is happening much faster than the air conditioner compressor!
One of the best examples of this sort of deduction comes from car engine sounds. Why does a car engine sound the way it does, and what information about the car can we glean from a recording? Car and Driver published an article on this exact topic, which I highly recommend for those less familiar with how cars work. At its core, an engine is powered by a self-sustaining series of tiny explosions. Each of these explosions generates sound, and their steady rate gives them a distinct tone. I took a recording of the engine of my own car to analyze, and you can actually learn a lot just from looking at the graph. Click below to listen to the recording
and look below to see what it tells us!
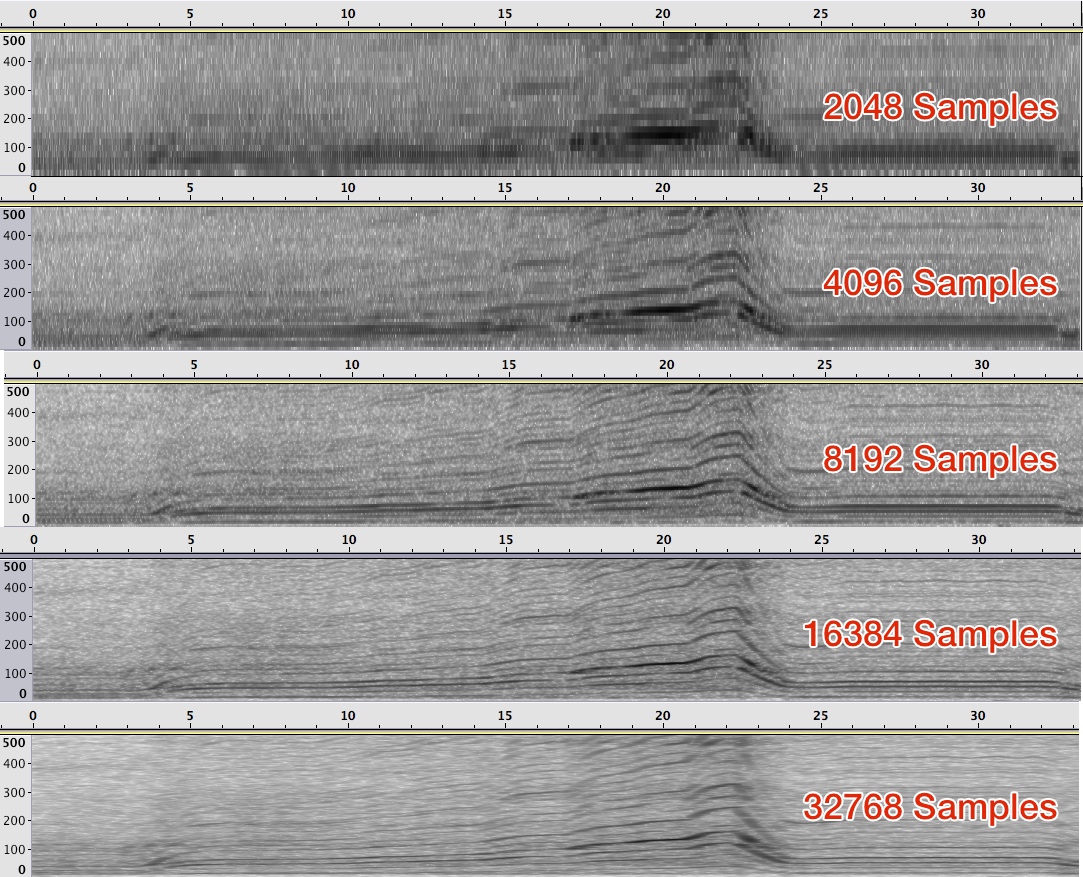
The graph is known as a spectrogram, a special plot that shows how frequencies (y-axis) change over time (x-axis). Much like how we perceive sounds when we hear them, time and frequency form two distinct axes in a spectrogram, with time increasing from left to right and frequency from bottom to top. The lines in the spectrogram represent “tones,” sounds with stable frequencies, or predictable rates. The engine sound has a lot of these lines and they are spaced in intriguing ways. The lowest line at any time is called the fundamental. This frequency reflects the rate that the engine completes a full cycle, also known as its RPM (revolutions per minute). The RPM is prominently displayed on the vehicle’s dash on the tachometer. Because sounds are measured in Hertz, which is a rate per second, converting to revolutions per minute involves a little multiplication. Also, the number of strokes of the engine matters, as a four stroke engine (like those found in a car) fires only once every other revolution of the engine.
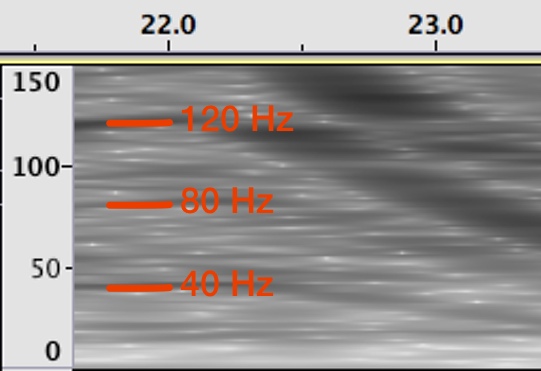
So, with the lowest line in the graph being 40 Hz, we can multiply that number by 30 to find 1200 RPMs! We can even figure out the number of cylinders in the car by looking at the lines above that fundamental, also known as “overtones.” The most prominent overtone in this set is at 120 Hz, about three times the fundamental, meaning that this is a six-cylinder engine. And, since we can see the frequencies rising together, we can see that the RPM increased over time, as the car revved up.
While the spectrogram is useful, when one really thinks about it, the spectrogram also raises some questions. How does a spectrogram take sound, a one dimensional record of pressure, and turn it into something two-dimensional? More importantly, how does it separate time and frequency, which are so closely linked? This is where the Uncertainty Principle comes in.
To measure frequency, one must measure how many times some event occurs within a given span of time. So the spectrogram looks at chunks of time, and finds the frequency spectrum of that chunk. The longer the time measured, the more accurate that spectrum estimate will be. But to track something which changes over time, like the changing frequency of the accelerating car, the shorter the time frame looked at, the more precisely one can pinpoint the state at a given moment. This creates a tradeoff: the better you measure frequency (by looking at longer timeframes), the worse you measure any change over time. Because you cannot have both an infinitely long and an infinitely short measurement, there will always be some uncertainty in either frequency or time, regardless of method.
To see this principle in action, consider the upper set of spectrograms. The top spectrogram uses sections of the recording with 2048 measurement samples, with each spectrogram below this showing the results with a doubling of the sampling rate. Each measurement has the same time between them, and with a measurement frequency of 44,000 Hz, the time between measurements is 22.7 nanoseconds. As a result, while the bottom spectrogram uses 745 milliseconds of data, the top uses only 46.5 milliseconds. As the resolution along frequency increases, the time frequency is reduced, illustrating the tradeoff determined by the uncertainty principle.
For quantum mechanics, the limiting factor is the quantization of electron momentum. For acoustics, the limiting factor is the quantization of measurements, determined by the frequency that a sample is measured. The shorter the time between acoustic samples, the more precisely you can find both frequency and time (incidentally, this will also allow for the measurement of higher frequencies, but that is a story for another article).
Keeping this in mind, the uncertainty principle of quantum mechanics is not truly a mystery of the universe that can be used to explain away anything, as science fiction authors have used it. Instead, it is the simple limit that arises when you want to measure two related values, but one of those values is measured discretely. The next “World Through Sound” will consider frequency and sound speed together to look at wavelength, the fundamental measure of distance for waves of all sorts.
Andrew “Pi” Pyzdek
Andrew “Pi” Pyzdek is a PhD candidate in the Penn State Graduate Program in Acoustics. Andrew’s research interests include array signal processing and underwater acoustics, with a focus on sparse sensor arrays and the coprime array geometry. Andrew also volunteers his time doing acoustics outreach and education as a panelist and moderator on the popular AskScience subreddit and by curating interesting acoustics news for a general audience at ListenToThisNoise.com.
Contact info: andrew@pyzdek.com