
Page 17 - January 2006
P. 17
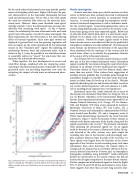
 ble for wind-induced infrasound noise may provide another means of mitigating wind noise. Figure 6 illustrates the gen- eral characteristics of the functional relationship between wind and infrasound noise. We see that at low wind speeds the wind has relatively little effect on the observed infra- sound noise. However, above some threshold wind speed, typically around 1-2 m/s, the infrasound noise increases dra- matically with increasing wind speed. As Fig. 6 demon- strates, the relationship between infrasound noise and wind speed varies with seasons, even for the same wind speed. The likely explanation for this observation is the wind filtering effect of seasonal vegetation. Since most pipe rosettes are deployed at ground level even low growing vegetation will have an impact on the wind experienced by the infrasound sensors in this “boundary layer” regime. By exploiting the relationship between wind and infrasound noise, such as shown in Fig. 5, it may be possible to use wind observations to essentially subtract or “cancel” the wind noise that con- taminates the infrasound observations.
Taken together, the new developments in sensor and wind-filter design, combined with our improving under- standing of the physical mechanisms responsible for wind- generated noise, are providing important new tools for mitigating the impact of wind noise on infrasound obser- vations.
  Shuttle investigation
Acoustic emissions from space shuttle missions on their return to Earth have been routinely observed at infrasound stations located at several locations in continental North America. As sound passes through the atmosphere, stratifi- cation of winds and temperature as well as turbulence modi- fies the received signal. Sound propagating from source to receiver along different paths can arrive at the receiver at dif- ferent times giving rise to time-separated signals. Below and to each side of the shuttle path, there is a sonic boom carpet, defined by the Mach cone of the shuttle intersecting the Earth’s surface. Outside the carpet, signals similar to those from subsonic sources were observed that can be predicted if
38 atmosphericconditionsarewellestablished .Theinfrasound
array stations can determine the direction of the signal that when combined with the trajectory of the re-entry and the arrival times, allows us to identify the approximate location of the source of the infrasound emission.
The ill-fated STS-107 Columbia shuttle mission is prob- ably one of the best studied infrasound events. Infrasound signals recorded by ten stations during the reentry have been
38,39
Infrasound arrays that clearly detected the re-entry of this mission were located at Pinon Flat, CA, Newport, WA, at Lac du Bonnet, Manitoba of the International Monitoring System, from experimental infrasonic arrays operated by Los Alamos National Laboratory at St. George, UT, Los Alamos, NM, and Pinedale, WY, from arrays operated by Southern Methodist University at Mina, NV and Lajitas, TX, a National Oceanic and Atmospheric Administration (NOAA) array located near Boulder, CO, and a temporary array at White Sands Missile Range operated by the Army Research Laboratory. Figure 7 shows the location of these stations in relation to the known trajectory of the shuttle, along with the
38
signals associated to the re-entry . The primary conclusions
from analyzing the infrasound signals are: (a) no signals could be detected at the arrays in Hawaii and Alaska; (b) sig- nals detected at the other stations were quite simple for recording sites close to the trajectory and increasingly com- plex at greater distances from the path of the Columbia; (c) these signals were largely from the direction of the closest approach of the Columbia to each recording array, with some information from other directions; (d) stations Mina, St. George and Los Alamos that are all within 100 km of the tra- jectory, detected clear bow or N waves; and, (e) atmospheric propagation modeling using InfraMAP32 could sufficiently predict the arrival times at the nearest stations, but did not account for all signal complexity at the more distant stations. Further comparison of infrasound signals to those for flights STS-77, STS-78, and STS-90 that had similar re-entry trajec- tories suggests that other than an hour-long acoustic emis-
analyzed in an attempt to better understand this tragedy Data from stations in Texas and New Mexico clearly show more than one arrival. Other stations have suggestions of multiple arrivals, probably due to multiple paths through the atmosphere though it is possible that some come from frag- ments or debris from the break-up of the shuttle. Without explicitly identifying the size and location of debris, based on our current limited experience with such datasets, it is diffi- cult to unambiguously separate these two hypotheses.
.
 Fig. 6. Infrasound noise, as a function of average wind speed during 2004 for a station in Kazakhstan. The different colored symbols show the average values for different months of the year. Dashed lines are for reference and have slopes of 2, 3, and 4.
Infrasound 15
