
Page 37 - January 2006
P. 37
and hissy), and characteristics (broadband, with tones, and with time-fluctuating components). Many of the conditions are based on recordings made in real spaces. We have calibrat- ed these recordings so that the sound being reproduced in the lab very nearly matches what was measured in the real-life spaces. Some examples of the sources heard in these noise con- ditions are an apartment heat-pump, a research laboratory fume hood, twin exhaust fans above a library, and a screw compressor above an office. Figure 2 shows sample spectra of two noise conditions that exhibit a low frequency tone at 120 Hz. The two are essentially identical except for the prominence of the tone; the tone in noise condition A has a higher promi-
26
ety of performance tasks, including typing, math, grammati- cal reasoning, and proofreading. These computer-adminis- tered tests are carefully developed to be equally difficult across all trials. Prior to the testing, all participants are pre- screened to ensure that they meet a required level of audito- ry and visual function and a minimum typing ability of 20 words per minute.
Participants also complete perception questionnaires under each noise exposure. These questionnaires ask them to rate their general impressions of various qualities of the test- ing room, including the noise, temperature, lighting, and work station comfort. (Recall that only the background noise is manipulated, though.) Additional questions specifically ask them to rate the noise with regard to loudness, annoy- ance, distraction, tonality, fluctuations over time, and rum- ble, roar, and hiss characteristics.
The testing takes place over multiple testing days to reduce fatigue. When each participant is finished with all of his/her testing sessions, he/she completes a post-study sur- vey. They are asked if the noises remind them of anything they have heard before. The majority of subjects have responded that the noises sound like HVAC noise, with com- ments such as, “the noise in my office,” or “air-conditioning.” When prompted to identify where they think the noises are coming from, most have responded that they are coming from above the ceiling somewhere. Several thought the noise was coming from the air diffuser located adjacent to the over- head panel loudspeaker. This indicates to us that we are real- istically mimicking the content and localization of HVAC noise.
After much statistical analysis...
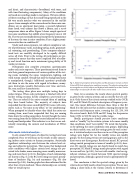
In all, around 650 hours of subjective testing have been completed. First, we will focus on the results to date connect- ing indoor noise criteria to human perception. Statistically significant relationships exist between the criteria level rat- ings and subjective perception. That means that background noise conditions with higher criteria level ratings are per- ceived to be louder, more annoying, more rumbly, more roar- ing, and more hissy (p<0.01). Examples of such relationships are shown in Fig. 3; as the RC level rating increased, percep- tions of loudness (Fig. 3a) and annoyance (Fig. 3b) also increased (p<0.01). Similar graphs have been obtained for the other four criteria methods. These relationships are certainly what we would expect.
nence ratio than in condition B.
Under each noise exposure, test subjects complete a vari-
Fig. 3. Subjective perceptions of (a) loudness and (b) annoyance increase as Room Criteria (RC) level rating of noise conditions increases. The subjective rating values are averaged across 30 test subjects and displayed with standard error bars. Similar relationships were found for the other indoor noise criteria tested.
Next, let us examine the results about spectral quality, as given by the criteria systems and as rated by the test sub- jects. Only three of the criteria systems studied so far (NCB, RC, and RC Mark II) include descriptors of frequency con- tent. One major difference between these three is that RC Mark II is the only one that includes a roaring descriptor for excessive mid-frequency noise, covering the 125, 250, 500 Hz octave bands. Both NCB and RC lump the frequencies from 16 Hz to 500 Hz into the rumble range.
Ideally, participants should perceive noise conditions rated as “rumbly” by the criteria systems to be more rumbly than conditions rated “not-rumbly.” We tested this hypothe- sis by splitting the noise conditions into groups, depending on their rumble, roar, and hiss ratings given by each criteri- on. A statistical analysis was then run to see if the perception ratings were higher for (a) the rumbly versus not-rumbly groups, (b) the roaring versus not-roaring groups, and (c) the hissy versus not-hissy groups. Results are mixed. RC spectral ratings match perception in terms of rumble (p<0.01); how- ever, RC spectral ratings are not clearly found to match hiss perception. RC Mark II ratings match perception with regard to roar and hiss (p<0.01), but not with rumble. And no sig- nificant relations are found between NCB spectral ratings and perception, although a general trend is appropriately fol- lowed.
Our conclusion is that the spectral ratings given by the criteria do not fully match subjective perception. We are now taking a closer look at the various criteria to determine if
Noise and Worker Performance 35
