
Page 19 - Spring 2007
P. 19
been studied intently by those in the aerospace and nuclear communities, particularly in the 1960’s and 1970’s.
Try holding your hand or fingers lightly on any structur- al surface, like a window when there is a lot of noise outside. You will feel the window vibrating. The physics that explain this phenomenon are the same as those that explain how a vibrating structure radiates sound. As we will see, there are several quantities in sound-induced vibration that are com- plementary to those in vibration-induced sound.
Let us start by considering the acoustic field adjacent to a flat infinite plate that is struck by an incoming acoustic wave. There are many pressure waves next to the structural surface—the incident wave, a reflected wave, and a wave re- radiated by the structure, which has been forced into vibra- tion by the incident and reflected waves. The sum of the inci- dent and reflected waves forms a ‘blocked’ pressure on the surface, and if the surface is rigid, the blocked pressure field is the total pressure. If the structure is flexible and vibrates, it radiates a third pressure wave, which sums with the blocked pair to form the overall pressure field.
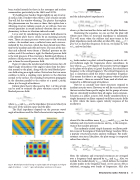
Figure 10 shows the incident and reflected waves for a 30 degree angle of incidence (the angle is taken from the direc- tion normal to the plate), along with the total blocked pres- sure field acting on a rigid surface. Notice how the two waves combine to form a standing wave pattern in the direction normal to the surface. The standing wave pattern propagates in the direction parallel to the surface at a speed cοsin(φ), where φ is the angle of incidence.
Infinite plate theory (discussed in Part 1 of this article) can be used to estimate the plate vibration caused by the blocked pressure field:
, (17) and the infinite plate’s impedance is
(18)
,
where η is the structural loss factor and h is the plate thickness.
Examining the equation, we can see that the plate will
vibrate most when its structural impedance is minimized.
This will occur when the stiffness and mass terms in the
plate’simpedancecanceleachother,orwhenD(k sinφ )4 = ο ινχιδεντ
ρhω2 Let us find this frequency. To do so, we replace kο with ω/cο, and we find that:
(19)
.
looks similar to a plate’s critical frequency, and to its crit- ical radiation angle for frequencies above coincidence. In fact, when φινχιδεντ is 90 degrees (the acoustic waves propagate in the plane of the plate, or ‘graze’ the plate), the coincidence frequency is the critical frequency. The critical frequency, in fact, is sometimes called the lowest coincidence frequency. This means that there is no single frequency where the plate vibrates most—there are several of them, each of which cor- respond to a different angle of incidence.
Now let us consider how finite structures respond to incident acoustic waves. However, we will do so not for waves that are incident from specific angles, but for groups of waves that are statistically incident from all angles, more common- ly known as a diffuse acoustic field. Smith9 considered how a simple harmonic oscillator responds to diffuse acoustic fields in 1962, where the mean square velocity response of the oscillator is
,
where zφλυιδ and zπλατε are the impedance (pressure/velocity in this case) of the acoustic space and the plate.
The fluid impedance depends on the pressure wave’s angle of incidence and the fluid’s characteristic impedance:
(20)
ω
χο
,
(16)
where M is the oscillator mass, Rραδιατιον and Rστρυχτυρε are the radiation and structural resistances, and Gππ is the autospec- trum of the incident pressure.
The randomly excited simple harmonic oscillator prob- lem is one of the origins of Statistical Energy Analysis (SEA), a popular structural-acoustic analysis technique. For multi- resonant structures, like plates, the plate energy is computed rather than velocity:
(21)
Here, the radiation and structural resistances are averaged over a frequency band spanned by ωμιν and ωμαξ. Also, we include the modal density nπλατε, which defines the number of plate modes in the frequency band. As we can see, SEA is statistical, averaging over bands of frequencies. SEA also
Fig. 10. Blocked pressure field acting on a plate (right side of images) at 30 degree angle of incidence. ‘+’ and ‘–’ signs indicate phase variations in the waves.
Structural Acoustics Tutorial 2 17
