
Page 38 - Summer 2007
P. 38
ly by looking to see whether the green line is to left or right of the red line for that particular time location. Only the beat in the center of the graph is exactly synchronized.
Note that the CHKDOT diagrams are a direct represen- tation of standard MB subdivision and counting, albeit with more fine grained timing information included, whereas the DIFFDOT plots are a novel view of the same information, essentially looking at the “first difference” form of the origi- nal timing information.
Choice of frequency resolution and short time Fourier transform window overlap was constant for each processing run, but may differ for different samples. Sometimes a single sample was processed repeatedly, using several different choices of parameters. These results provided an interesting insight into the “Heisenberg Uncertainty” aspect of the time/frequency tradeoff that is inherent to Fourier analysis. A 2048 point fast Fourier transform (FFT) and three to ten millisecond time slice overlap are well suited to many sam- ples. In some cases a time resolution as short as 0.5 millisec- onds was used. Visual inspection of the spectrogram allowed a choice of the frequency bands most likely to distinguish musical notes played by various instruments. Sets of the pos- sibly overlapping frequency bands are summed to obtain time series plots of the audio power in the several bands.
Musical samples
Analysis results for several Swing tunes are included in this article: It Don’t Mean a Thing (if it ain’t got that Swing) by Duke Ellington and Irving Mills, performed by Duke Ellington and Louis Armstrong (1962); Graceland by Paul Simon (1986); Fever by Eddie Cooley and John Davenport, performed by Ray Charles and Natalie Cole (2004); examples of Brazilian Samba batucada music from the CDs Grupo
Batuque Samba de Futebol (2004) and Os
Ritmistas Brasileiros Batucada Fantastica
(1963/1998) by Luciano Perrone and
Nilo Sergio.
It Don’t Mean a Thing (if it ain’t got that Swing) (Duke Ellington and Louis Armstrong 1962)
Figures 1, 1a and 1b show spectro- grams of the introduction to It Don’t Mean a Thing (if it ain’t got that Swing). Figure 1 is the overview of the 19.3 sec- ond sample, showing the entire Fourier spectrum up to 22,050 Hz (half of the CD sampling rate of 44,100 sam- ples/sec). The main feature of the first few seconds of the spectrogram is the high frequencies produced by the hi-hat cymbal playing the classic “tchzzz-tch- ta-tchzzz-tch-ta-tchzzz...” Jazz swing rhythm. The low frequency bass and piano parts are shown in the lower por- tion of the plot as a thick red swath. Louis Armstrong’s trumpet dominates the remainder of the sample, clearly revealing the harmonic structure, tim-
ing and pitches of the notes. Figures 1a and 1b show close-up views of the cymbal and piano/bass section. The inherent technical limitations of Fourier analysis are clear in the coarse low frequency resolution of the piano and bass data. Fulop and Fitz’s (2006) reassigned spectrogram technique would have revealed much more useful information that is obscure in the current figures.
The rhythms played by the bass/piano and hi-hat are plotted in their corresponding frequency bands as shown in Fig. 1d as a time series. Note events were marked at the power peaks of the waveforms, and their temporal locations were collected. This sample was analyzed using five millisecond temporal resolution that was sufficiently fine grained to measure accurately the timing of note events in this song. The time deltas are plotted in Figs. 1e and 1f with longer times at the top and shorter times at the bottom. The musical pulse note events, played by piano/bass, appear at the top, and the hi-hat syncopation is in the lower part of the figure. Notice in particular that the pulse is not uniform. Rather, it alternates between slight “pushes” and slight “pulls” on the beat, i.e., the notes are intentionally not played in a strict mechanical metronomic style. The longest, shortest and aver- age pulse time deltas are marked with blue horizontal lines. The average delta time has been used as the canonical pulse clock tick. The backbeat (1/2 of the pulse) and swung note deltas (1/3 and 1/6 of the pulse) are more uniform than the pulse, indicating that these syncopated notes follow more closely the uniform timing paradigm of MB meter, although departing from the “divide by 2” metaphor. Keep in mind that the DIFFDOT plot is the time difference between notes, and should not be interpreted as mirroring standard musical tablature form. The CHKDOT plot does correspond to the
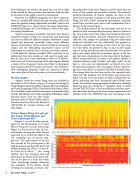
Fig. 2. Spectrogram of “Graceland” intro.
Fig. 2a. Close-up showing bass and drums.
36 Acoustics Today, July 2007
