
Page 13 - April 2008
P. 13
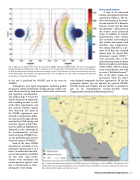
 Fig. 2. Maps of ray endpoints that reach the ground for WSMR2 (left) and WSMR3 (right). The rays were propagated through atmospheric profiles shown in Fig. 1, starting at 33.175o N, and 106.515o W, altitude 40 km, the center of the region in which the detonations took place (marked on each map by a red X). For illustration, we have not considered rays that turn in the thermosphere; these would arrive significantly later. The ray endpoints are color coded according to the predicted arrival time in seconds after detonation.
to the east is predicted for WSMR2 and to the west for WSMR3.
Atmospheric and signal propagation modeling guided the general station distribution, though specific station sites were chosen based on land access, local winds and terrain, and logistical considerations.
The maps in Figs. 3-5 show the
relative locations of explosions
and recording stations in each
of the three experiments, and
also indicate whether signals
were observed. The dates of
the WSMR experiments were
selected to sample three differ-
ent characteristic high-altitude
wind patterns (fall, spring, and
summer). Figures 4 and 5 illus-
trate the different deployments
designed to take advantage of
the predominantly westerly
winds of spring (WSMR2) ver-
sus the predominantly easterly
winds of summer (WSMR3).
Each of the three WSMR experiments consisted of two explosions separated by 4 to 6 hours, to understand the influ- ence of atmospheric variability on this time scale better. Surface wind conditions and station operator logistics were also a consideration in deter- mining the event timing.
Organization’s International Monitoring System.20
All but three of the stations used infrasound arrays. In addition to acoustic measurements, some stations also recorded meteorological data (surface wind speed, wind direction, and temperature). One station (HELSTF, at a dis- tance of 60 km) also recorded seismic data. Six optical fiber infrasound sensors (OFIS)17,18 were co-located with a 4-ele- ment infrasound array at station BACA. At another set of stations (NMT, NMT2, NMT3) a dense array of microphones was used to create a “distributed sensor.”19 Five of the thirty stations are permanent, while the others were deployed temporarily for these experiments. Of the five permanent stations, four are operated for research (DLIAR, NVIAR, SGAR, and TXIAR), and one (I57US) is operated as part of the Comprehensive Nuclear-Test-Ban Treaty
Infrasound stations
A total of 30 infrasound stations participated in the three experiments (Table 1). The sta- tions were located in the south- ern and western US at distances between 35 and 1213 km from
16
the explosions.
  Fig. 3. Infrasound stations participating in the WSMR experiment on Septemper 9, 2005 (WSMR1). The explosion site is marked with a red star. Epicentral distance circles every 200 km from the explosion site are also indicated. The station sym- bols indicate whether signals were observed or not.
 Infrasound Calibration Experiments 11
