
Page 22 - January 2009
P. 22
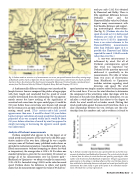
 Fig. 2. Derham made an extensive set of measurements over a two-year period between the artillery training range at Blackheath and his church at Upminster. He also made other measurements, often between his church and other churches in Essex–the elevation of the church towers being useful. (Base map, Vicinity of London, reproduced by per- mission from The Historical Atlas by William R. Shepherd, Henry Holt and Company, NY, 1911.)
A fundamentally different technique was introduced by Joseph Sauveur. Sauveur compared the pitches of organ pipes with their length and concluded that the speed of sound could be determined from this relationship. He was approxi- mately correct but knew nothing of the significance of acoustical end corrections for open-ended pipes; it would be 150 years before these corrections were known well enough for the resonance in an open-ended pipe to be useful for esti- mating sound speed. [This century-and-a-half period appears more than once. It would be about 150 years before Laplace’s proper calculation of sound speed from the physical properties of air was accepted widely and it would be about 150 years before refraction of sound by wind (as opposed to simply increasing or decreasing the apparent sound speed) was understood.]
Analysis of Derham’s measurements
Derham compiled what appears to be the largest set of sound speed measurements of his time but he did little quan- titative analysis of his own data. Although he was a capable surveyor, none of Derham’s many published works shows an aptitude for mathematical analysis. Considering all of his pub- lished measurements (without attempting to correct for wind or temperature), the average value is 1138 ± 25 ft/s where one standard deviation is given for the uncertainty. If, instead, we average all of his measurements over his favorite path— Blackheath to Upminster—we obtain virtually the same result: 1135 ± 28 ft/s. Instead of citing 1135 ft/s as the value for sound speed, Derham shows his deference to others and merely claims that his measurements support the value of 91⁄4 half-sec-
onds per mile (1142 ft/s) obtained by Flamsteed and Halley. There is little significant difference between Derham’s value and the Flamsteed/Halley value but Derham reports many measurements with their baseline distances and support- ing meteorological observations. (See Fig. 2.). [Derham also cites the speed of sound as 9 1/4 half-second vibrations per mile of travel. This works out to 1142 ft/s. Apparently, there is no extant reference to the Flamsteed/Halley measurements other than Derham’s paper so it is possible that Flamsteed and Halley reported the same 9 1/4 half-seconds rather than 1142 ft/s.]
A one-way measurement is influenced by wind. Not all of Derham’s contemporaries agreed that wind was important but Derham left the question open and addressed it specifically in his measurements. His table of values from two years of observations from Blackheath to Upminster includes notation regarding wind direction and speed. His wind
speed notation was simply a number related to his perception of the wind force. If we use his wind direction to determine the component of his wind-force index that aligns with the direction of the path from Blackheath to Upminster, we can calculate a wind-speed index that relates to the degree to which the wind would aid or hinder sound. Plotting that wind-speed index against the measured travel time, there is a clear relationship between the two. Derham saw this rela- tionship from his numbers and, unless evidence is found to
  Fig. 3. Derham recorded wind direction and a speed number for each of the meas- urements he tabulates from Blackheath to Upminster. The vertical scale for this plot is derived from his values for wind direction and speed by projecting his index number onto the direction from Blackheath to Upminster. This gives a quantitative approximation to the aiding or retarding influence of the wind. Derham claims to have established a relationship between wind speed and sound speed and this plot substantiates that claim clearly in spite of the spread in his individual measure- ments. The black line is a linear-regression fit.
Derham’s De Motu Soni 21
