
Page 14 - Winter 2009
P. 14
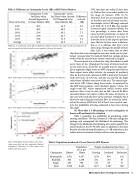
 Table 4. Difference in Community Levels (dB) at MSP Noise Monitor
Hour of the Day
"Community" Levels for Hours when Aircraft Reported to
be Near Monitor (dB)
"Community" Levels for Hours when Aircraft NOT Reported to be
Near Monitor dB)
Difference in Level
(dB)
8:00
48.3
44.5
3.8
9:00
48.3
48.2
0.1
10:00
53.6
46.1
7.5
11:00
53.8
42.7
11.1
12:00
54.8
51.4
3.4
Average
51.8
46.6
5.2
         Difference in Community Levels (dB) at MSP Noise Monitor between times when aircraft were reported to be near the monitor and when aircraft were not reported to be near the monitor.
  Fig. 4. “Non-airport” versus airport noise for daytime hours (7:00 a.m. to 10:00 p.m.).
DNL that does not really fit their data set. Rather, this curve under-predicts in the range of interest, DNL 55–70. Moreover, they use an incomplete data set that does not include many surveys. For example, in the 5 dB range centered at 60 DNL (57.5–62.5 dB), they predict 8 percent highly annoyed whereas the true percentage is more than three times the FAA prediction3 or about 25 percent highly annoyed. It was easy to show the errors in the airport’s position since the bias to their curve is obvious; that is, it is obvious that their curve does not go through the middle of their data. Also, it was rather easy to show
that their data were incomplete since one could use the pub- lished, reviewed data4 by Sanford Fidell that include all data world-wide for aircraft noise surveys reported in English.
The next point was to show that sleep disturbance would occur more or less throughout the zone of interest and not just in select areas. To do this we actually traced a large sam- ple of nighttime flight tracks at MSP using data provided on their airport-noise office website. An example of northerly flow on the two main runways at MSP is shown for the hours from 10:30 p.m. to 6:30 a.m., and one can see that the flight tracks form a blanket over most of the area. The sound expo- sure levels (SEL values) along these tracks, as measured by the MSP noise monitors, were tabulated. Figure 7 shows the single event SEL values experienced within various noise contours. Here it can be seen that an SEL value of 85 dB is exceeded almost everywhere within the zones of interest, in this case with northerly flow on the runways. Similarly, Fig. 8 shows the same thing for southerly flow. As stated, the meth- ods of the recent ANSI/ASA S12.9 Part 6 were used to com- pute the probability of being awakened at least once during the night.
(4) Show that a 5 dB package of noise mitigation in homes will ameliorate the situation
Table 5 quantifies the probability of awakening under existing conditions. We then assumed a 5 dB noise mitigation package and recomputed the likelihood of awakening. The change in the likelihood of awakening was used to quantify the noise benefits in the 60–65 DNL zone. In addition to the clear benefits of reduced sleep disturbance, a 5–dB reduction in the indoor noise environment clearly reduces noise annoyance.
  Fig. 5. “Non-airport” versus airport noise for nighttime hours (10:00 p.m. to 7:00 a.m.).
   Table 5. Population Awakened At Least Once by MSP Flyovers
Community
Homes
Population @ 1.5 per
Home
People Awakened at least Once
 Existing
Insulated
Reduction
Minneapolis
4,291
6,437
1,278
836
442
Richfield
845
1,268
252
165
87
Eagan
492
738
147
96
51
Total
5,628
8,443
1,677
1,097
580
Fig. 6. Minneapolis–St. Paul airport noise attitu- dinal survey data (red dots) compared to Federal Interagency Committee on Noise report3 and Fidell world-wide survey4
          Minneapolis Sues its Airports Commission 13
