
Page 27 - Spring 2010
P. 27
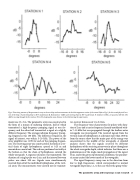
  Fig. 6. Directivity patterns of the parametric array as the two ships took measurements in the inhomogeneous section of the ocean. Refer to Fig. 2 for the actual physical loca- tion of the ships. Transmitting ship (1) R/V Academician B. Konstantinov (ABK) and receiving ship (2) R/V Academician N. Andreyev (ANA) are spaced at 400 km. The ABK is moving through the five stations (N1–N5), keeping the same distance to the ANA during the experiments.
iment was 2.5–3 m. The parametric array was constructed in the form of a mosaic of radiating elements, half of which transmitted a high-frequency pumping signal at one fre- quency, and the other half transmitted a signal at a slightly different frequency. The average radiation frequency (pump- ing frequency) was 150 kHz. The difference frequency, the signal of interest, was within 5–20 kHz. The power of the array amplifier was 1 kW for each of the pumping frequen- cies. The receiving array was constructed in the form of a ver- tical chain of eight hydrophones, spaced at 0.25 m and mounted on a metal rod. The rod was positioned vertically at the bottom so that the chain of hydrophones covered the whole waveguide. A sequence of pulses was transmitted. The duration of a single pulse was 2 ms, and the interval between pulses was about 300 ms. Signals were simultaneously received from all of the individual hydrophones of the verti- cal array. The measurements were carried out for transmit-
ter–receiver distances of 1 to 5.6 km.
The frequency–time characteristic for pulses with dura-
tion of 2 ms and a carrier frequency linearly modulated with- in 7–15 kHz that was propagated through the shallow water waveguide was investigated. The received signals from the vertical chain of hydrophones at a distance more than 1000 m from the source show that the major part of the energy was concentrated in the middle of the waveguide. A detailed analysis shows that the signals received by different hydrophones of the receiving array were in-phase throughout the whole waveguide depth, which indicates that there was a predominance of the single-mode propagation of the signal. Thus, under the given experimental conditions, the paramet- ric array excited the lowest mode of the waveguide.
The signal frequency sweep was in the direction from low to high frequencies, which corresponded to normal waveguide dispersion, i.e., to the case where the group veloc-
The parametric array and long-range ocean research 23
