
Page 23 - Acoustics Today Summer 2011
P. 23
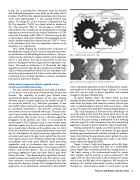
                                          Fig. 3. Simple spur gear and pinion setup.
 in Fig. 2a). A scanning laser vibrometer scans the forward and backward propagation wave fields on the other side of the plate. The ROI in this experiment includes all of the char- acters with approximately a 1 mm spacing between scan points. The image Mx,y of the characters is displayed in Fig. 2b. The characters “LANL” are clearly visible as maxima of Mx,y. The characters “EES-11” are not quite as visible. It is expected that these would show up as minima just as the high impedance scatterers used in the work of Anderson et al. The reason for the poorly visible “EES-11” characters may be due to the thickness of the plate relative to the wavelength, result- ing in a smaller impedance contrast from the “EES-11” letters to the aluminum plate than the impedance contrast in the Anderson et al. experiments.
Thus, RTM imaging for nondestructive evaluation of bounded plate samples may be used to image passive scatter- ers and locations of disbonding of those scatterers. This pro- cedure may be carried out to image scatterers on the opposite side of a thin plate if that side is inaccessible. It may also prove to distinguish between high and low impedance scat- terers. The work of Anderson et al. illustrated that high impedance scatterers showed up as minima in an RTM image and the work presented here shows that low impedance scat- terers show up as maxima, but further work needs to be done to determine why the high impedance scatterers considered here did not show up as minima.
Independent component analysis applied to non- invasive gear health monitoring
The non-invasive monitoring of the health of gearbox- es16 has been a very active area of research over the past two decades. The capability to predict gear failures from accelerometer-based measurements of the gear meshing vibration signal is of great importance in industries such as the aerospace industry (e.g., helicopter gearboxes). If one can predict failure, then gears can be swapped during regu- lar scheduled maintenance. This prevents accidents and saves money due to unscheduled down time. The main con- cept in gear health monitoring is that the meshing of the gear and pinion (Fig. 3) gives rise to a vibration signal that propagates to the gearbox case where it is measured by accelerometers. The challenge is that, in real systems, many vibration signals arise due to vehicle motion, shaft imbal- ances, mode shape vibrations of the gearbox case, etc. All of these are also present at the measurement points necessitat- ing the development of signal processing approaches that can isolate and analyze the gear mesh signal from the unde- sired signals (noise). Past condition-monitoring techniques of gearboxes have used many different signal processing approaches such as synchronous time series averaging,17 amplitude and phase demodulation,18 time–frequency distri-
19
processing approaches have also taken hold in gear tooth
21
20
Non-linear adaptive algorithms for inde- pendent component analysis (ICA) have been shown to sep- arate unknown, statistically independent sources that have been mixed in dynamic systems. This example illustrates the application of an information maximization based blind-
bution,
and wavelet analysis.
The use of statistical signal
failure detection.
 Fig. 4. Crack formation and growth at the base of a gear tooth.
 source separation algorithm (a type of independent compo- nent analysis) to the prediction of gear failures. It is shown that ICA can be used to detect impulsive and random changes in the gear vibration data.
In typical gearbox setups, the pinion drives the gear through rotational motion where force is exerted on the gear teeth where the pinion teeth come into contact with the gear teeth. A common failure of the gear teeth occurs when a crack occurs at the base of the tooth due to material fatigue (Figure 4).
The crack formation at the base of the tooth begins to cause the tooth to flex when the pinion exerts force on the tooth. Because the tooth flexes, there is a slight delay in the rotation of the gear causing a modulation of the meshing vibration signal. It is this modulation that fault monitoring algorithms attempt to detect before the tooth actually fails.
Having measured the signals at several locations on the gearbox surface, the next task is to separate the gear-pinion meshing signal and determine whether a change (or modula- tion) occurs during the gear-pinion contact period. One can- didate algorithm for performing these tasks is the blind- source separation algorithm (BSS).
Figure 5 shows a high level diagram of the BSS algo- rithm. The approach assumes that there are r independent source signals that are linearly mixed by a mixing matrix A. This linear mixing is the mathematical model for signals from multiple sources arriving at each accelerometer. The signals X(t) are then measured at the accelerometer points and fed into the BSS part of the algorithm. BSS attempts to minimize the mutual information between accelerometer channels (i.e., measurements made at several points on the
Physical and Engineering Acoustics 19
