
Page 31 - Volume 12, Issue 2 - Spring 2012
P. 31
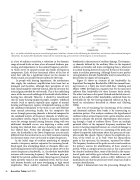
  Fig. 1. (a) Auditory thresholds in quiet for normal hearing-listeners (solid line), a listener with a mild hearing loss (dashed line), and a listener with a moderate hearing loss (dotted line). (b) Auditory filter bandwidths estimated for the normal-hearing, and two listeners with hearing loss at several frequencies.
 in a loss of auditory sensitivity, a reduction in the dynamic range of sound levels we hear, a loss of normal loudness pro- cessing, and impairments to the normal frequency selectivi- ty, which serves to separate sounds into bands of frequency components. Each of these functional effects of the loss of outer hair cells has a significant impact on the manner in which sounds are encoded for perception by the brain.
In people with hearing impairment, the mechanisms that supply the nonlinear amplification have been lost or damaged, and therefore, although their perception of very loud sounds might be relatively normal, they do not enjoy the internal gain provided for soft sounds. This is the underlying cause of the increased audiological thresholds which define a hearing loss clinically. However, it should be remembered that for many hearing-impaired people, complex, wideband sounds (such as speech) typically span regions of normal hearing and frequency regions of impaired hearing, so that the combined stimulation to the brain is not only different from normal processing locally, but the composite that occurs through processing channels is distorted compared to the combined outputs of frequency channels in wholly nor- mal auditory systems. Figure 1a shows a frequency threshold curve for average normal hearing listeners, along with two additional threshold curves, one depicting a rather mild hearing loss (dashed line), and one showing a more severe loss (dotted line). Notice that although in both impaired cases, the thresholds in the lower frequencies are not much different from the normal curve, as is fairly common, hearing loss becomes more severe in the mid to upper frequencies.
In the initial stage of cochlear processing of complex sounds a frequency analysis separates the incoming broad- band signal into overlapping bands or channels. Most nor- mal-hearing listeners have channels that are about 10% of the center frequency in bandwidth, i.e., the absolute bandwidths increase with increasing frequency. The nonlinear gain pro- vided by the normal cochlea makes these frequency channels fairly narrowly tuned at low amplitude levels, but the chan- nels become broader and more overlapping at high sound amplitudes. These auditory channels or bandwidths are
 broadened in the presence of cochlear damage. The frequen- cy channels defined by the auditory filters in the impaired cochlea are broader and more overlapping than is observed in normal-hearing listeners because of the loss of the nonlin- earity in cochlear processing. Although there is not a perfect correspondence, broader bandwidths may be somewhat pre- dicted from the degree of hearing loss.
Figure 1b shows an estimate of the bandwidths (in Equivalent Rectangular Bandwidths–ERB) for normal-hear- ing listeners at a fairly low level (solid line). Glasberg and Moore (1990) developed an equation that fits the measured auditory filter bandwidths for these listeners fairly closely. The other two lines in this panel (dashed and dotted) are esti- mates of the auditory filter bandwidths calculated from the thresholds for the two hearing-impaired subjects in Fig 1a, based on calculations described in Moore and Glasberg (2004).
One way of visualizing the functioning of the normal and abnormal auditory filter banks is by constructing an excitation pattern. This analysis combines the hypothesized cochlear outputs across frequency for a given stimulus, and is meant to simulate the spectral representation after process- ing through a bank of auditory filters. There are multiple potential effects of the impaired frequency resolution that occurs in hearing-impaired listeners as a result of damage to outer hair cells. One of these is a smearing of the peaks and valleys that provide information about the spectrum of com- plex sounds like speech. Figure 2 shows the amplitude spec- trum of the vowel /a/, as in “ball.” Note the characteristic peaks in this spectrum, the formants, separated by valleys. The frequency locations of the peaks in each vowel sound are the primary sources for identification of these sounds in speech. When a complex spectrum such as this is processed by a bank of auditory filters, some of the detail in the separa- tion of peaks and valleys gets reduced. However, in normal- hearing listeners, sufficient peak-to-valley differences are maintained such that the processed vowel sound can lead to accurate identification.
Figure 2 demonstrates how the processing through the
30 Acoustics Today, April 2012
