
Page 39 - Spring 2015
P. 39
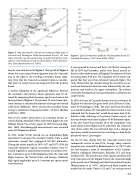
  Figure 5. Map showing the inbound and outbound flight paths of Concorde into Washington Dulles International Airport, VA. Inset shows schematic ray tracing indicating ray paths through the strato- sphere (~40-50 kilometers) and the thermosphere (100-130 kilome- ters). From Balachandra et al. (1977).
may be seen with the aid of Figure 3. The top left of Figure 3 shows the cruise carpet boom signature from the Concorde and to the right is the resulting secondary boom signa- ture. Note that the Concorde secondary boom is consider- ably lower in overpressure and frequency than the primary boom.
A further indication of the significant difference between the secondary and primary boom signatures may be ob- tained by comparing their frequency spectra as shown in the lower portion of Figure 3. The primary N-wave boom spec- trum contains a considerable amount of energy out beyond 1,000 hertz (Holbeche, 1972), whereas the secondary boom energy is confined to frequencies below ~50 hertz (Rickley and Pierce, 1980).
One of the earliest observations of secondary booms oc- curred during controlled NASA sonic boom flight tests over Wallops Island, VA, in July-August of 1959 (Lina and Mag- lieri, 1960). Microbarograph measurements were recorded some 195 kilometers distant.
In 1974, Liszka (1978) carried out an unpublished flight experiment to measure the secondary booms from a small supersonic aircraft that propagated 600-900 kilometers. During the winter months of 1976-1977 and 1977-1978, the Concorde infrasonic signals (secondary booms) were re- corded regularly at measurement stations in northern Swe- den at distances up to 5,000 kilometers from the Concorde flights between the United States and Europe. Relatively high signal amplitudes up to 0.1 newtons per square meter were observed.
Figure 6. Typical temperature profile for the atmosphere based U.S. Standard Atmosphere, 1976. From NASA (1976).
It was reported by Lessen and Pryce (1978) that during the fall of 1976 and thereafter, noises were heard, mostly in- doors, in the southwest part of England, the majority of these occurring about 9:30 p.m. The regularity of the noises sug- gested that they were from inbound Concorde flights. The study showed that the sounds leaving the aircraft in an up- ward and downward direction were influenced by the tem- perature and winds in the upper atmosphere. The authors eventually developed ray-tracing techniques to delineate the carpet booms.
In 1976, the issue of Concorde booms over the southwest of England was discussed in great detail in the House of Com- mons by Penhaligon (1978). The noise had been described as secondary booms. He reminded the ministers that it was indicated that the boom skirt would be no more than 20 ki- lometers wide (referring to the primary boom carpet), yet the same booms were heard at places 65-80 kilometers apart. It was also stated that virtually all of the complaints were made about inward flights and he asked that the Concorde slow down earlier. He was informed that such a change in operations would increase fuel use, resulting in a load factor penalty of some 12 passengers.
On the US side, shortly after the Concorde entered into commercial service in mid-1976, strange, sharp acoustic impulses were recorded by Balanchandra et al. (1977) with the low-frequency array of microphones at the Lamont- Doherty Geological Observatory, Palisades, NY, and from Durham, NH. The arrival times of the signals correlated well with Concorde arrivals. Figure 5 shows the Concorde flight paths in and out of Washington Dulles International Airport (Balanchandra et al., 1977). Altitude and Mach number are marked on the tracks. Points A, B, and C are average source
  | 37
