
Page 16 - \Winter 2015
P. 16
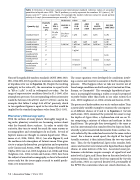
 Table11::EvEovloultuiotinonofoAfmAemreicraicnanantiaotnioanl anl danindteinrnteartnioantaiolnsatalnsdtanrdarerdferefnecrenvcaeluveasloufesacofuastciocualstical
(pico-), respectively. For example the modern reference value for sound particle
  quantitiesinliquiidsssininccee11995511..TThheeSSIIpprerefifxiexessμμ,,nn,,aannddpprereppreresseennttththeennuumbbeerrss1100 (m(micircor-o),-)1,010
1−212 (nano-) and 10
(nano-) and 10 (pico-), respectively. For example the modern reference value for sound particle
−
velocity is 1 nm/s (one nanometer per second) = 109 m/s. −
velocity is 1 nm/s (one nanometer per second) = 10 −9m/s.
6−6 9 −9 −−
 Reference value (q0)
          Quantity (q)
 Field (F) or Power (P)
      ASA Z24.1- 1951
  ANSI S1.1- 1960
    ANSI S1.8- 1969
   ANSI S1.8- 1989
   IEC 60050- 801:1994
   ISO/DIS 1683:2013
 20 μPa 20 μPa or
sound pressure F or 105 105 μPa 1 μPa 1 μPa 1 μPa 1 μPa
μPa
        sound exposure P 1 μPa2 s
        sound power P 1 pW 1 pW 1 pW 1 pW
        sound intensity P 1 pW/m2 1 pW/m2 1 pW/m2 1 pW/m2 1 pW/m2
        sound energy P 1 pJ 1 pJ
        sound energy density
P 1 pJ/m3
        sound particle displacement
F 1 pm
        sound particle velocity
F 10 nm/s 1 nm/s 1 nm/s
        sound particle acceleration
F 10 μm/s2 1 μm/s2
        frequency 1 Hz
        distance 1 m
        None of the applicable modern standards (ANSI 1989, 2013; IEC, 1994; ISO, 2013) specifies or mentions a standard value of impedance for use in Equation (2). Despite the resulting ambiguity in the value of I0, the convention to report levels in “dB re 1 μPa” is still in widespread use today. For the range of representative conditions listed in S1.1-1960, all at atmospheric pressure, the corresponding reference intensity would be between 0.64 aW/m2 and 0.71 aW/m2, and in the examples that follow I adopt 0.65 aW/m2 precisely, which to two significant figures is equal to the value that would be implied by the standard impedance value from Z24.1-1951.
Planetary Oceanography
With the surfaces of many planets thoroughly mapped us- ing radar, planetary scientists are becoming curious about what lies beneath those surfaces. In order to satisfy this curiosity, they turn to sound for much the same reasons as oceanographers and seismologists do on Earth. Several of Jupiter’s moons are thought to contain liquid water (Huss- mann et al., 2006; NASA, 2014 ) (see also Figure 2), and the methane-rich atmosphere of Saturn’s moon Titan gives rise to a unique hydrocarbon precipitation and evaporation cycle (Lunine and Atreya, 2008). Both Europa (Kovach and Chyba, 2001; Lee et al., 2003; Leighton et al., 2008) and Titan (Leighton et al., 2004; Arvelo and Lorenz, 2013) have been the subject of acoustical oceanography, so far of a theoretical nature only, but the issues apply as much to model predic- tions as to measurements.
The sonar equations were developed for conditions involv- ing a source and receiver in seawater at Earth’s atmospheric pressure. What happens when we take our receiver out of these benign conditions on Earth and put it instead on Titan, Europa, or Ganymede? This seemingly hypothetical ques- tion is increasingly becoming a reality as sound is proposed to probe bodies other than Earth in our solar system (Lee et al., 2003; Leighton et al., 2004; Arvelo and Lorenz, 2013).
The presence of hydrocarbon seas on its surface makes Titan a particularly suitable example to examine the consequenc- es of different choices of Z and Z0 in Equation 2. (Arvelo and Lorenz, 2013) examined the potential for sonar to map the depths of Ligeia Mare, a hydrocarbon-rich sea on Ti- tan comprising a mixture of ethane and methane in their liquid forms. The principle they investigated is the same as used in conventional echo sounders fitted to ships on Earth, whereby a pulse transmitted downwards from a surface ves- sel is reflected by the seabed and received at the same surface vessel. For a known sound speed, the depth of the liquid (usually seawater) is then inferred from the two-way travel time. Thus, for the hypothetical Ligeia echo sounder, both source and receiver were immersed in liquid methane, liquid ethane, or some mixture of the two. Associated sonar per- formance calculations require concepts of signal level and noise level in Ligeia, and I focus here on the noise level at the receiver position. This noise level was expressed by (Arvelo and Lorenz, 2013) as a spectral density level, presumably of the EPWI (the convention when not stated otherwise), de-
14 | Acoustics Today | Winter 2015
