
Page 26 - 2016Fall
P. 26
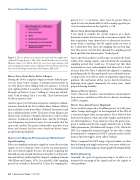
Smart People Behaving Foolishly
 Figure 1. The six phases of a project are real, and they apply espe- cially well to large projects. This “joke” should be taken very seriously. Human nature is to blame others for one’s own shortcomings, and innocent people are often used as “fall guys.” Derived from a poster by Decision Technology Corporation, Kensington, MD, 1976.
Horror Story About Faster, Better, Cheaper
During the 1990s, a popular slogan in various federal agen- cies was faster, better, cheaper. A manager instructed me to use that phrase when talking with our sponsors. I refused and explained that it is foolish to violate the Fundamental Principle of Projects. I got a “talking to” about my attitude, and I “took a beating” for it. I was told, “That’s how you have to talk to sponsors now.”
Another agency, the National Aeronautics and Space Admin- istration, launched the $125 million Mars Climate Orbiter Spacecraft that crashed into Mars (National Aeronautics and Space Administration, 1999). The project team forgot to get mixed units of distance (English and metric) to jibe in their software. Lockheed used English units, and the Jet Propul- sion Laboratory used metric units. It is no wonder that the spacecraft crashed. The project deliverables may have been faster and cheaper, but they were clearly not better. Smart people behaving foolishly.
Common Signal-Processing “Gotchas”
Signal Sampling
Errors in sampling continuous signals to create discrete time signals are very common. I have seen far too many projects that used aliased signals because the people acquiring the data did not pay enough attention to the physics of the prob- lem and did not understand the Nyquist sampling theorem (McGillem and Cooper, 1974). In a nutshell, if the sampling period (in seconds) is denoted by T, then the sampling fre-
quency is ƒs= 1/T (in hertz), and ƒs must be greater than or equal to twice the bandwidth (B) of the analog signal to pre- serve the information in the signal or ƒs ≥ 2B.
Horror Story About Signal Sampling
I was asked to estimate the system response of a shock- hardened recorder that measured accelerometer signals. The data-acquisition team showed me accelerometer measure- ments from a centrifuge, but the signals made no sense to me. I asked how they chose the sampling rate on their digi- tizer. The answer was that they adjusted the sampling period knob until the time domain plots “looked good.”
I got a spectrum analyzer oscilloscope, measured the band- width of the analog signals, and calculated the maximum sampling period they could use. It turned out that their measurements were undersampled and aliased by a factor of more than 100. Once I adjusted the digitizer’s sampling period properly, the data made good sense and my later pro- cessing results were able to solve an important engineering problem. The real horror of this story is that they had been digitizing their signals improperly for many years. Smart people behaving foolishly.
Abuses of Fourier Spectra
I have witnessed countless miscalculations, misinterpreta- tions, misuses, and abuses of the discrete Fourier transforms (DFTs) of signals.
Horror Story About Fourier Magnitude
Some scientists proposed a $2 million project to study some subtle “bumps and wiggles” in the magnitude of the DFT of a measured signal from an experiment. They believed that they knew the physics that caused the wiggles and wanted to test their hypotheses. I was asked to review the project pro- posal. I commented that the wiggles looked to me a lot like Gibbs phenomena (McGillem and Cooper, 1974). When the DFT of a temporally truncated signal (or one with a jump discontinuity) is computed, the DFT contains artifacts in the form of spectral wiggles, often called “leakage.”
When I computed the DFT using a tapered window on their data, the bumps and wiggles went away. I was never asked to re- view another of their proposals. Smart people behaving foolishly.
Data Chasing
Generally, the goal of signal processing is to allow us to interpret the meaning of the signals and use the signals to solve problems.
 24 | Acoustics Today | Fall 2016
