
Page 53 - 2016Fall
P. 53
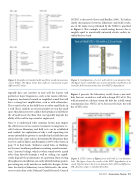
   Figure 1. Examples of standard walls and their sound transmission classes (STCs). The figure shows how walls are constructed to give different STC values.
typically does not correlate to how well the barrier will perform at lower frequencies, such as for rooms with low- frequency mechanical sounds or amplified sound that will have a strong bass amplification, such as with subwoofers. The second is that in the field there are often small holes in a wall. These could be an electrical outlet or even the small space that did not receive caulk at the bottom of a wall where the drywall meets the floor that can typically degrade the ability of the wall to stop sound as engineered.
Once it is understood what common factors may impact the effectiveness of an acoustic treatment, incongruous re- sults between laboratory and field tests can be established and verified. An explanation of why a wall separating two rooms intended for privacy as installed in the field does not always have the same value as determined by laboratory data was best said by Harris and Foundotos (1997) who wrote on page 73 in their book, “Airborne sound leaks, or flanking, are the most insidious problem in resolving sound transmis- sion.” Acoustic leakage, which is when sound travels a path other than directly through a wall or ceiling, can signifi- cantly degrade the performance of a partition. Basic testing throughout an installation can easily identify leakage points, preventing any costly mistakes or ineffective designs. At this time, for clarity of laboratory versus field results, the exten- sive research done at the National Canada Research Council
(NCRC) is discussed (Gover and Bradley, 2006). To further clarify discrepancies between laboratory and field results, one of the many tests performed by the NCRC is provided in Figure 2. This example is worth noting because this is roughly equal to acoustically untreated electric outlets in- stalled back-to-back.
Figure 2. Configuration of a test wall with 2.5-cm-diameter hole. The figure shows a wall that was constructed with a small hole to be tested for field sound transmission class (FSTC) degradation.
Figure 3 presents the laboratory results from a one-inch hole that was created in a wall with a design STC of 56. The wall measured at a distance from the hole has a field sound transmission class (FSTC) of 51, but near the hole, the wall has a FSTC of 41.
   Figure 3. FSTC results of Figure 2 test wall with 2.5-cm-diameter hole. The figure shows the results of the FSTC degradation of as much 10 points due to the 2.5-cm-diameter hole. LD, level difference; DR, dynamic range; σ, standard deviation.
 Fall 2016 | Acoustics Today | 51
