
Page 33 - 2016Spring
P. 33
with quieter models. When the study commenced, the noise levels in much of the plant were between 85 and 95 dBA. After the presses were replaced, the levels were reduced to less than 85 in those areas. This success was accomplished by stipulating noise requirements for the new presses that manufacturers had to achieve.
Small businesses don’t have the economic clout to demand quieter tools and processes. Therefore, businesses must rely upon the tool manufacturers to supply information that permits an informed decision. The NIOSH Power Tools da- tabase is one possible solution; however, it is focused on a narrow segment of the market. What is needed is a larger and more comprehensive resource where information about emission levels can be stored and accessed easily for compa- nies that desire to lower noise levels in the workplace. Prod- uct noise labeling is necessary.
Regardless of the company size, an assessment must be made to understand the noise levels of the equipment being used and a commitment must be made to replace noisy equipment with quieter, less hazardous pieces. Annual assessments can consider a variety of factors: hearing disability claims; acci- dents involving hearing loss or communication impairment; trends in noise dosimetry; retirement of noisy equipment; identification of noisy equipment in need of replacement; purchases of quieter equipment; interactions with vendors to identify better products; and efforts to market Buy Quiet to the workforce.
A three-tier approach can be used. First and most expensive is the Nike approach, “Just Do ItTM.” Regardless of the cost, the quietest equipment will be purchased. This approach may only be practical for a limited number of items. The “Show Me the Money” approach involves knowing what noise lev- els are produced by tools in your current inventory and as- signing penalties to the products that have no data, followed by searching a database, such as the Power Tools database, to find comparable products with lower noise ratings and costs that are within budget. A cost benefit calculation that accounts for hearing disability, workers compensation, tool cost and continued maintenance can be applied to deter- mine which tool yields the best value. The third approach, “Do No Harm,” limits purchases to just those products that are no louder than existing equipment. Products that have no sound power data are assumed to be among the noisiest products in the database. A product with comparable price and similar capabilities and known sound power data can be selected. In the next cycle of review and equipment re-
placement, products with lower sound power ratings can be selected. This brings us to the problem of noise ratings and labeling.
Noise Labels
When the Noise Control Act was passed in 1972, the US Environmental Protection Agency was given the authority to regulate products that produce noise and products that reduce noise. EPA promulgated two rules that describe the Noise Rating and the Noise Reduction Rating (EPA, 1972, 1979). The Noise Rating is based upon sound power emis- sions. Noise Ratings were required for only a few products before the Office of Noise Abatement and Control was zero- funded in the 1980’s. Subsequently, EPA rescinded the regu- lations for Noise Ratings. Hearing protection devices still are required to have a Noise Reduction Rating according to the 1979 rule. Product noise labeling has seen a resurgence of interest with stricter international regulations, particu- larly in the European Union (EU). Noise declarations are required for equipment sold in the EU markets.
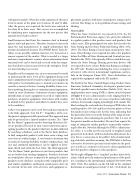
The Institute for Noise Control Engineering, Product Noise Emissions Technical Committee developed a product noise label and a product noise declaration (Nobile, 2011). An ex- ample product noise rating (PNR) is shown in the left panel of Figure 4. It uses a dimensionless scale ranging from 0 to 120. To the left of the scale are icons of speakers indicating soft, low-level sounds ranging to loud high-level sounds. The blue bar along the scale indicates the range of PNR values for similar products (89–109) and the red arrow points to 90 on the product noise rating scale for this item, indicating that this particular device is near the bottom of the range of simi- lar products, thus informing the purchaser that it is one of the quietest models on the market. The inset box reports the range of ratings for similar products, numerically reinforc- ing the blue bar. Note that although the PNR is a dimension- less value, it is really just the measured A-weighted sound power level in decibels, with the decibel notably absent. In a way, this is a concession to the public’s lack of understand- ing of decibels and their meaning. The PNR label is both an informative declaration (presents actual values for the prod- uct) as well as a comparative declaration (shows qualitatively how this product compares to other products).
On the right of Figure 4 is a “standard” product noise decla- ration, which gives the numerical performance of the prod- uct according to the international standard ISO 9296-1988 (ISO, 1988). The numbers on the left half of the standard declaration are sound power in bels1 (1 bel = 10 decibels) for
Spring 2016 | Acoustics Today | 31
