
Page 41 - 2016Spring
P. 41
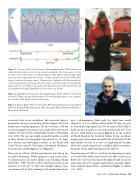
  Figure 2. Cartoon of the Ocean Acoustic Tomography method. The minimum in sound speed provides an axis for an acoustic waveguide. The time sequence of ray arrivals is from steep (red) to moderate (black) to flat (green) launch angles (flat, axial rays cannot generally be resolved). A representative ray for each of the three classes is shown in the upper panel. Transmission 2 (relative to 1) shows earlier ar- rivals of steep rays but no change otherwise. This is consistent with a warming of the upper ocean (or, less likely, a warming of the abyssal ocean) with intermediary and axial depths unchanged. Modified from Worcester et al. (2005).
Figure 3. Top Right, Greenland Sea Tomography Experiment. Walter is on the deck of the R/V Knorr during the Greenland Sea mooring deployment cruise, Septem- ber–October 1988. Photo from Peter Worcester.
Figure 4. Bottom Right, Walter on board the R/V Cory Chouest arriving at Heard Island on Australia Day (January 26, 1991) during the Heard Island Feasibility Test. Photo from Jeff Cordia.
  associated with ocean circulation. The mesoscale plays a prominent role in ocean mixing and has unique effects on underwater sound propagation. The first 300 km × 300 km ocean tomography experiment was conducted in 1981 in the Atlantic (Ocean Acoustic Tomography Group, see Behringer et al., 1982). The concept caught on quickly and has resulted in three decades of tomographic experiments by US, Japa- nese, French, and Norwegian scientists, in the Pacific and Arctic Oceans and the Norwegian, Greenland, Mediterra- nean, Barents, and Philippine Seas (Figure 3).
Never one to settle for 300-km experiments, not with an en- tire globe beckoning, Walter proposed using ocean acous- tic transmissions to measure global ocean warming (Munk and Forbes, 1989). The idea is that sound speed in the ocean increases 4–5 m/s per °C. Thus, for example, taking a typi- cal estimate of 5 m°C/yr warming at the sound channel axis
over a 10-megameter (Mm) path, the travel time would change by –0.1 s/yr. Walter convinced the US Navy to assist in a feasibility experiment. In 1991 an array of Navy HLF-4 hydroacoustic transducers was lowered from the R/V Cory Chouest (with Walter on board, Figure 4) in the vicinity of Heard Island in the Southern Indian Ocean, an almost unique spot that permits ensonification of both the Pacific and Atlantic Oceans. It is also at a high-latitude location where the sound channel axis is shallow, which accommo- dated the 300 m depth limitation of the HLF-4s.
Transmissions at 57 Hz (to avoid electrical machinery noise at 50 and 60 Hz) with a source level of 221 dB re 1 μPa at 1 m RMS were received at locations throughout both oceans by teams from the US, Canada, South Africa, Australia, India, New Zealand, Japan, France, and Russia (Figure 5) (Munk et al., 1994).
Spring 2016 | Acoustics Today | 39
