
Page 46 - 2016Winter
P. 46
Highway Traffic Noise
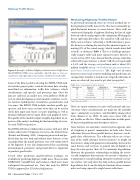
Figure 8. Examples of Federal Highway Administration Traffic Noise Model (FHWA TNM) views and tables. Top left: skew or cross-sec- tional view; top right: plan view; bottom: sound level results table.
Some of the data needed to develop the FHWA TNM mod- els includes project plans, contour/elevation data, develop- ment/land use information, traffic data (volumes, vehicle classifications, and speeds), and pavement type. Once the data are collected, an analyst uses seven different TNM ob- jects to aid in developing accurate models: roadways, receiv- ers, barriers, building rows, terrain lines, ground zones, and tree zones. The FHWA TNM includes roadway profile, per- spective, and skew (cross-section) views that can be used to check data input and ensure accurate modeling as well as dynamic linking between input tables and graphical views. The quality of the model’s output is highly dependent on ex- pertise of the analyst, including his/her knowledge of acous- tics and TNM best practices.
The FHWA TNM was validated for accuracy with over 100 h of data collected at 17 highway sites across the United States (Rochat and Fleming, 2002). Comparing measured and pre- dicted data for sites with and without noise barriers, it was concluded that the model performs very well within 500 ft of the highway. It was also demonstrated that considering meteorological, pavement, and ground effects is important to produce good results.
Several other prediction models/software packages are available for predicting highway traffic noise. These include NORD2000, SoundPLAN, and CadnaA, which have more widespread international use. Note that only the FHWA TNM is approved for US federal aid projects.
ducing highway traffic noise levels. The most commonly ap- plied abatement measure is a noise barrier. These walls are constructed alongside a highway, blocking the line of sight between vehicles and people in the community. Blocking the line of sight typically reduces the sound by 5 dB, and this is fairly easy to achieve. Achieving a 10 dB reduction is possi- ble; however, reducing the noise by this amount requires re- moving 90% of the sound energy (which sounds about half as loud), as shown in Table 1. This is a challenge and gen- erally requires taller and more expensive noise barriers. A recent survey of US states showed that the average reduction achieved by noise barriers is about 7 dB, the average height is 14 ft, and the average cost per linear mile is about $2.5 million (available at http://www.fhwa.dot.gov/environment/ noise/noise_barriers/inventory/). The high cost of noise barriers is one reason accurate modeling and predictions are so important. Another is to make sure targeted reductions in noise are achieved (you want to get what you pay for!).
There are many variations in noise wall material and con- struction, where considerations are made for the available space, community acceptance, and durability among other items (Knauer et al., 2000). In some cases, noise walls are not feasible or effective. Other considerations include paral- lel barrier degradation and absorptive surfaces.
Noise barriers are sometimes constructed on opposite sides of a highway to protect communities on both sides. Noise reflections between these parallel barriers, however, can de- grade their effectiveness. The reflection effects are a func- tion of the width (distance between barriers) to height (of the barriers) along with geometric relationships between the road, barrier, and receivers. A general rule-of-thumb is to keep the ratio greater than 20:1 to minimize degradation. However, the geometric relationships including the receiv- ers add complexity that warrants site-specific evaluation. It is important to consider adding absorptive material to a bar- rier surface. Not only does this help reduce parallel barrier degradation, but it can also help in situations where commu- nities are being exposed to single barrier reflections.
Thanks , HM
Reducing Highway Traffic Noise
Updated TABLE 1 is at the bottom of this page. Please scroll down.
As previously mentioned, there are several methods for re-
Table 1. Ease of obtaining noise barrier reduction
Insertion Loss, dB
Degree of Difficulty
Reduction in Sound Energy, %
Relative Reduction in Loudness
5
Simple
68
Readily perceptible
10
Attainable
90
Half as loud
15
Very difficult
97
One-third as loud
20
Nearly impossible
99
One-fourth as loud
In general, increasing insertion loss requires increasing barrier height. From Highway Traffic Noise, NHI course 142051
44 | Acoustics Today | Winter 2016
