
Page 49 - 2018Fall
P. 49
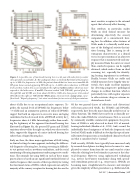
 Figure 3. A possible case of functional hearing loss in a 42-year-old male factory worker who operated a wood lathe. A: The audiogram shows a relatively flat bilateral hearing loss up to ~4 kHz. For frequencies >4 kHz, the patient claimed that test tones were inaudible. B: DP-gram shows normal-appearing DPOAEs up to ~3-4 kHz where reductions in DPOAE levels are then evident; this occurs initially for the right ear (yellow circles), which was more exposed to the lathe noises. C and D: Transient-evoked OAE (TEOAE) spectral plots for the right (C) and left (D) ears from about 200 Hz to 5 kHz also show poorer click-evoked TEOAEs for the right ear (TEOAE-R). White areas, emission levels; orange areas, noise- floor levels. "Repro by frequency", test-retest correlations for two series of click presentations.
most sensitive receptors to the external agents that adversely affect hearing.
This attribute, in particular, makes OAEs an ideal clinical measure for determining objectively the sensory component of a sensorineural hear- ing loss. In addition, other features of OAEs make it a clinically useful mea- sure of the biological activity that ini- tiates hearing. That is, among its ad- vantageous characteristics as a clinical test is its representation of an objective response that is noninvasively and sim- ply measured from the outer ear canal. Thus, emitted responses can be rapidly obtained, which makes them an ideal screening test, especially for identify- ing hearing impairment in newborns. Finally, because OAEs are stable and reliably measured over lengthy time in- tervals, they make excellent monitors for detecting progressive pathological changes in cochlear function, which is particularly true with regular exposure to either ototoxic drugs or extreme in- dustrial noise levels.
 about 4 kHz due to an occupational noise exposure. To- gether, the normal levels of DPOAEs for frequencies below ~3-4 kHz and an asymmetric pattern of reduced DPOAEs suggest that both an exposure to excessive noise and aging contributed to the decreased levels of DPOAE activity for f2 frequencies above 4-5 kHz. Interestingly, rather than resolv- ing the legitimacy of the apparent functional hearing loss illustrated in Figure 3A, the poorer DP-gram and TEOAE emissions observed for the right ear, which was closest to the lathe, support the diagnosis of a noise-induced hearing loss rather than a feigned hearing loss.
Early on, then, the three major applications of OAE testing in clinical settings became apparent, including the differen- tial diagnosis of hearing loss, hearing screening in difficult- to-test patients such as newborns and infants, and the serial monitoring of hearing impairment under progressive condi- tions. The rationale for using OAEs in each of these major practical uses is based on one significant beneficial feature of emitted responses that consists of their specificity for testing the functional status of OHCs, which represent not only the majority of the sensory receptors for hearing but also are the
Of the two general classes of reflection- and distortion/ reflection-generated OAEs, the TEOAEs and DPOAEs, respectively, have been the most clinically useful tests of co- chlear function. The SOAEs have not been as clinically use- ful as the evoked OAEs for several reasons. First, as assessed by commonly available commercial equipment, the preva- lence of SOAEs is only observed in about 50% of normal- hearing individuals (Moulin et al., 1993). And, second, the individually based uniqueness of both the frequencies and levels of SOAEs make it difficult to develop this type of natu- rally emitted response into a standardized clinical test based on what is considered to be “normal.”
Until recently, SFOAEs have typically been measured only by research-based phase-tracking devices because it is com- plicated to extract them from the ear canal sound at a time when the eliciting low-level stimulus is present at the iden- tical frequency. However, using sophisticated technology (e.g., inverse fast Fourier transforms) along with special- ized stimulation protocols (e.g., swept tones), SFOAEs are becoming more straightforward to measure and interpret given the simplicity of their generation (e.g., Kalluri and Ab-
Fall 2017 | Acoustics Today | 47
