
Page 41 - Spring 2018
P. 41
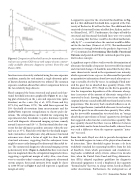
 Figure 4. Comparison of threshold curves for mammalian cen- tral nervous system (CNS) tissue with output of some commer- cially available ultrasonic diagnostic systems. From Fry and Dunn (1973).
function were extensively evaluated using the same exposure condition, namely, for each animal, a single ultrasonic pulse of known duration and intensity was utilized. The common exposure condition allowed for a direct comparison between the two relatively large datasets.
Floyd compared the brain structural and spinal cord func- tional threshold outcomes graphically (Figure 4) on a log- log plot of intensity on the y-axis and exposure time (pulse duration) on the x-axis (Fry et al., 1970; Dunn and Fry, 1971; Fry and Dunn, 1973). The solid lines represent the 50% threshold observations from measurements and the dashed lines represent extrapolations to shorter pulse du- rations. The extrapolations are valuable for comparing the experimental data thresholds to pulse durations typically used with diagnostic ultrasound imaging systems, namely, around 1 microsecond (10−6 s). The functional data here rep- resent the day-old mouse paralysis outcomes when the ani- mal was at 37°C. Floyd observed that the threshold magni- tudes (intensities) of embryonic (day-old mouse) functional outcomes were about a factor of eight less than the adult structural outcomes, suggesting that the embryonic tissue might be more easily damaged by ultrasound than adult tis- sue. The commercial diagnostic ultrasound imaging system peak intensity levels (Figure 4, dashed-line box) were much lower in magnitude than the extrapolated magnitude values, suggesting a significant margin of safety. Also, even if one were to consider today’s commercial diagnostic ultrasound system outputs, their peak intensity levels might be closer to 1,000 W/cm2 in Figure 4 and still represent a significant margin of safety.
A supportive aspect for the structural threshold line in Fig- ure 4 is that additional threshold data, acquired at the Uni- versity of Rochester, fit well on the line. The additional data consisted of structural lesions of rabbit liver, kidney, and tes- tes (Frizzell et al., 1977). Furthermore, the slopes of both the structural and functional threshold lines were very nearly −1⁄2, meaning that the lines could be described mathemati- cally by I t1⁄2 = a constant where the constant would be differ- ent for the two lines (Dunn et al., 1975). This mathematical expression is strongly related to the paralysis slope term \[1/ (I1⁄2 t)\] mentioned in Determining Thresholds: Functional Outcome and pointed out Floyd’s continued quest for quan- titative dose concepts.
A significant aspect of these studies was the determination of ultrasonic thresholds of exposure for irreversible functional and structural changes. It should be noted that the key ultra- sonic characteristic varied in the experiments was intensity, which represents tissue exposure to ultrasound but provides no quantitative information about how much ultrasonic en- ergy is actually absorbed by tissue. Accordingly, Floyd initi- ated the quest for an absorbed dose quantity (Dunn, 1962; Johnston and Dunn, 1976). Floyd was the first to quantify in vivo the temperature dependence of the ultrasonic absorp- tion (a measure of the amount of ultrasonic energy that is converted to heat), showing that in vivo tissue exhibits ab- sorption behavior considerably different from that of in vitro preparations. This discovery had a marked influence on ul- trasonic hyperthermia (controlled ultrasonic tissue heating) and on the quest for an ultrasonic dose quantity. Thus, utiliz- ing the irreversible mammalian structural data, an “energy absorbed per unit volume of lesion” quantity was developed that suggested a direction for a universal dose quantity. This dose quantity showed that there was no difference between gray and white matter brain lesion thresholds, whereas there was such a difference when the exposure quantity “inten- sity” was used.
From this work, Floyd was able to provide descriptions of the threshold regions in terms of the physical mechanisms of interaction. These threshold regions became a de facto worldwide standard for separating bioeffects from the lack of bioeffects, from which government and standard-set- ting bodies established safety criteria. Almost two decades later, when the United States Food and Drug Administra- tion (FDA) adopted regulatory guidelines for diagnostic ultrasound equipment, it used a biophysical dose quantity “thermal index” that was, to a large extent, based on Floyd’s earlier observations. Furthermore, the widespread use of
 Spring 2018 | Acoustics Today | 39
