
Page 23 - Winter2018
P. 23
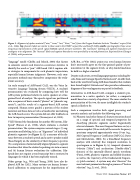
 Figure 1. Alignment of spoken material (“nine,” “seven,” “two,” “three,” “two”) from the Oregon Graduate Institute “Numbers” corpus (Cole et al., 1994). Top: phonetic labels are similar to those used in the TIMIT corpus (Zue and Seneff, 1988); middle: spectrographic (time versus frequency) representation of the speech signal; bottom: speech pressure waveform. The “automatic” labeling and segment boundaries are analogous to an alignment. The “manual” labels and segment boundaries were provided by a trained phonetician. Reprinted from Chang et al. (2000), with permission.
 “language” model (Chelba and Jelinek, 2000) that factors in semantic context and lexical co-occurrence statistics to identify the word as “pan.” ASR-based CALL requires oth- er strategies to compensate for such phonetic imprecision, especially human listener judgments. However, such com- pensatory methods may themselves compromise the evalu- ation’s accuracy.
An early example of ASR-based CALL was the Voice In- teractive Language Training System (VILTS). A student’s pronunciation was evaluated by comparing how well the ASR system performed relative to native speakers at a fine- grained level of analysis. The speech signal was partitioned into a sequence of basic sounds (“phones” or “phonetic seg- ments”), and the results of a segment-based ASR system compared. Human raters graded a portion of the student material, and these data served as a baseline for normalizing the ASR-based scores. The system did not offer feedback on how to improve pronunciation (Neumeyer et al., 2000).
VILTS formed the foundation for another SRI system, Edu- Speak® (Franco et al., 1999), which evaluates a student’s pronunciation. The system comprises several stages: (1) seg- mentation and labeling (a.k.a. an “alignment”) of individual phonetic segments (see Figure 1); (2) a measure of the dis- tance between a student’s speech and a native-speaker model (based largely on the similarity of their frequency spectra); (3) a comparison of automatically aligned phonetic-segment durations that takes the student’s speaking rate into account; and (4) human listener evaluations for calibration. Edu- Speak does not require a word transcript but is restricted to languages for which it has been explicitly trained.
Other groups (e.g., Witt and Young, 2000) have also de- ployed ASR for CALL. Many systems use human listener- based calibration to compensate for the imperfections of
ASR. But, as Witt (2012) points out, even human listeners don’t necessarily agree on the fine-grained quality of pro- nunciation (at the segment level), so why should machines be held to a higher standard?
Despite such caveats, several language programs, including Ro- setta Stone and Carnegie Speech’s NativeAccent®, do offer feed- back at the word level (using ASR-based models) that students have found helpful. NativeAccent® also provides rudimentary diagrams of the vocal apparatus as part of its feedback.
Alternatives to ASR-based CALL compare a student’s pro- nunciation to a native speaker’s (or rather, a composite model based on a variety of speakers). The more similar the pronunciation of the two, the more intelligible the student’s speech is likely to be.
Such a comparison involves both signal processing and acoustic analysis, and includes the following steps.
(1) Phonetic (and other forms of) feature extraction based on a range of spectral and temporal properties for classifying phonetic segments and/or linguistically relevant elements. The most frequent features are (a) a coarse snapshot (25 ms wide) of the acoustic frequency spectrum computed approximately every 10 ms (e.g., Mel Cepstral Frequency Coefficients [MFCCs]; Davis and Mermelstein, 1980); (b) a broadband frequency analysis with relatively fine temporal resolution (a spectrogram as in Figure 1); (c) temporal dynamics (velocity [“delta”] and acceleration [“double-delta”] features) of the spectrally filtered speech waveform (Furui, 1986), phonetic-segment and syllable duration as well as the trajectory of the fundamental frequen- cy (pitch contour). A system may also “discover” the most relevant parameters through a process of “feature selection” (e.g., Li et al., 2018).
Winter 2018 | Acoustics Today | 21
