
Page 20 - Fall2020
P. 20
EXPOSURE TO ULTRASOUND IN AIR
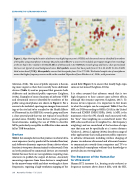
Figure 2. Maps showing the location of airborne very high frequency sonic (VHFS) and ultrasound sources identified by members of the public using smartphones in Europe (A) and London (B). For a source to be included, spectrogram images from recordings at the site had to be e-mailed to the Health Effects of Ultrasound in Air (HEFUA) research group and have a clear spectral peak that was not typical of usual background noise. Red symbols, sources that have peaks from 17.8 to 22.4 kHz (in the 20-kHz third-octave band [TOB]); blue symbols, sources that have peaks from 15 to 17.7 kHz. The limited sample rate of smartphones means that higher frequency sources could not be recorded. Reproduced from Fletcher et al., 2018c, with permission.
Glorieux, 2018). The issue of public exposure is becom- ing more urgent as there have recently been additional devices (Table 1) used or proposed that generate both deliberate and incidental public exposures (Leighton, 2016a). Examples of source locations of airborne VHFS and ultrasound sources identified by members of the public using smartphones are shown in Figure 2. For a source to be included, spectrogram images from record- ings at the site had to be e-mailed to the Health Effects of Ultrasound in Air (HEFUA) research group and have a clear spectral peak that was not typical of usual back- ground noise. Notably, these devices tend to generate tonal emissions, making the use of TOBs to describe MPLs particularly susceptible to difficulties when sounds fall at TOB boundaries.
Devices
Table 1 lists example devices that produce incidental ultra- sonic exposures (as a by-product of the intended function) and deliberate ultrasonic exposures (from a device whose function is to expose a human/animal to ultrasound). Data on levels produced by commercial devices are extremely limited because there are no regulations requiring man- ufacturers to publish the output of devices. Accurately measuring exposures from these devices is complicated by the narrow beam width and short wavelength at these frequencies, requiring a high-resolution mapping of the
sound field (Figure 3) to ensure that locally high expo- sures are not missed (Leighton, 2016a).
It is often assumed that airborne sound that is too high frequency to hear cannot cause adverse effects, although this remains unproven (Leighton, 2017). To discuss device exposure, it is important to first know to what the outputs can be compared. Table 2 has the MPLs in TOBs according to OSHA (2015) in the United States and ICNIRP (INIRC-IRPA, 1984). A MPL is the maximum value the SPL should reach measured with the “slow” time weighting on a sound level meter. The MPLs discussed here are Z-weighted (i.e., flat frequency weighting) and are considered at the location of expo- sure that may not be specifically at a 1-meter distance (Ueda et al., 2014a). Leighton (2016a) describes a range of other applications that could generate public exposures to airborne ultrasound, including wireless charging of phones via airborne ultrasound and ultrasonic beacons to communicate covertly from computers and TVs to an individual’s smartphone without their knowledge to provide data on viewing habits.
The Response of the Human Ear
to Ultrasound
Human HTL increases (i.e., hearing acuity reduces) as frequency increases above about 4 kHz, with the HTL
20 Acoustics Today • Fall 2020
