
Page 55 - Special Issue
P. 55
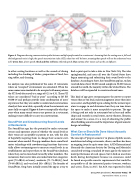
 Figure 4. Diagram showing communication paths between multiple people seated in a restaurant. Assuming that the seating area is full and the background noise is high, the speech transmission index (STI) value here will be lower, meaning that speech will not be understood very well. Green lines, direct speech; thick and thin red lines, reflected speech; blue curves, other noises such as the air diffusers.
 to other seating locations as well as the sounds of dining including the clanking of dishes, preparation of food, bus- sing tables, and cleaning.
An analysis was also performed of the same 13 restaurants where an “occupied” environment was simulated. When the same rooms were simulated to be occupied with more patrons, the STI levels decreased to a range of 0.21 to 0.31. These STI values are considered “bad or poor” according to BS EN 60268-16 and perhaps provide some confirmation of users’ experience that they are unable to understand conversations clearly at their own table, especially when the restaurants are more fully occupied. Figure 4 shows conceptually what hap- pens when many sound sources are present in a restaurant, making it more difficult to carry on conversations.
SoundPrint and Crowdsourcing Sound Levels at Restaurants
The SoundPrint app has the potential to make restaurant owners and operators aware of whether the sound levels at their venue are acceptable to patrons or not, with the idea of hopefully inspiring them to change their acoustic envi- ronment when needed. The app combines basic sound level meter technology with crowdsourcing functions that essen- tially allows restaurantgoers to measure sound levels in an establishment and report them to the SoundPrint database, where they can be stored and viewed by other members. The restaurants that receive data are ranked into four categories: quiet [70 dB(A) or lower], moderate [71-75 dB(A)], loud [76-80 dB(A)], and very loud [81+ dB(A)]. The founder of SoundPrint, Greg Scott, initially created the app as a way to
find a quiet spot to take a date in New York City. The idea springboarded, and users all over the United States have begun measuring and submitting their sound levels to the database. According to Scott, the SoundPrint app has, to date, received data of over 60,000 sound samples in 30,000 venues around the world, the majority within the United States. The database will be expanded to countries abroad soon.
This kind of app gives restaurantgoers the power to report venues that are too loud, make management aware that noise issues exist, and hopefully open a dialog for the owners/oper- ators to engage in and determine how they can tone down the space to make it more acceptable to patrons. The app is being used not only in restaurants but in bars and coffee shops and recently in retail stores, movie theaters, libraries, and arenas! In a sense, it is a way of educating the public about building acoustics and the importance of good acoustic design in buildings.
What Can or Should Be Done About Acoustic Comfort in Restaurants?
The concept of “proper acoustics” in places of public accom- modations including restaurants, diners, and bars has been an ongoing issue for quite some time. ASTM International (formerly the American Society for Testing and Materials) considered writing a standard 20 years ago for the measure- ment/performance of such spaces, but it died an uncertain death during development because no consensus could be found on specific acoustic requirements that would be acceptable to all the interested parties (owners, workers, and users). Then, in 2017, the ASA was requested to look
Spring 2020S, uSpmemciaerl I2s0s1u9e | Acoustics Today | 255 Reprinted from volume 15, issue 2
