
Page 41 - Summer2020
P. 41
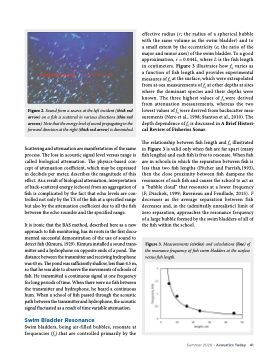
  Figure 2. Sound from a source at the left incident (thick red arrow) on a fish is scattered in various directions (thin red arrows). Note that the energy level of sound propagating in the forward direction at the right (thick red arrow) is diminished.
Scattering and attenuation are manifestations of the same process. The loss in acoustic signal level versus range is called biological attenuation. The physics-based con- cept of attenuation coefficient, which may be expressed in decibels per meter, describes the magnitude of this effect. As a result of biological attenuation, interpretation of back-scattered energy (echoes) from an aggregation of fish is complicated by the fact that echo levels are con- trolled not only by the TS of the fish at a specified range but also by the attenuation coefficient due to all the fish between the echo sounder and the specified range.
It is ironic that the BAS method, described here as a new approach to fish monitoring, has its roots in the first docu- mented successful demonstration of the use of sound to detect fish (Kimura, 1929). Kimura installed a sound trans- mitter and a hydrophone on opposite ends of a pond. The distance between the transmitter and receiving hydrophone was 43 m. The pond was sufficiently shallow, less than 4.5 m, so that he was able to observe the movements of schools of fish. He transmitted a continuous signal at one frequency for long periods of time. When there were no fish between the transmitter and hydrophone, he heard a continuous hum. When a school of fish passed through the acoustic path between the transmitter and hydrophone, the acoustic signal fluctuated as a result of time variable attenuation.
Swim Bladder Resonance
Swim bladders, being air-filled bubbles, resonate at frequencies (f0).that are controlled primarily by the
effective radius (r; the radius of a spherical bubble with the same volume as the swim bladder) and to a small extent by the eccentricity (e; the ratio of the major and minor axes) of the swim bladder. To a good approximation, r = 0.044L, where L is the fish length in centimeters. Figure 3 illustrates how f0 varies as a function of fish length and provides experimental measures of f0 at the surface, which were extrapolated from at-sea measurements of f0 at other depths at sites where the dominant species and their depths were known. The three highest values of f0 were derived from attenuation measurements, whereas the two lowest values of f0 were derived from backscatter mea- surements (Nero et al., 1998; Stanton et al., 2010). The depth dependence of f0 is discussed in A Brief Histori- cal Review of Fisheries Sonar.
The relationship between fish length and f0 illustrated in Figure 3 is valid only when fish are far apart (many fish lengths) and each fish is free to resonate. When fish are in schools in which the separation between fish is less than two fish lengths (Pitcher and Parrish,1993), then the close proximity between fish dampens the resonances of each fish and causes the school to act as a “bubble cloud” that resonates at a lower frequency (F; Diachok, 1999; Raveneau and Feuillade, 2015). F decreases as the average separation between fish decreases and, in the (admittedly unrealistic) limit of zero separation, approaches the resonance frequency of a large bubble formed by the swim bladders of all of the fish within the school.
 Figure 3. Measurements (circles) and calculations (line) of the resonance frequency of fish swim bladders at the surface versus fish length.
 Summer 2020 • Acoustics Today 41
