
Page 44 - Summer2020
P. 44
BIOACOUSTIC ATTENUATION SPECTROSCOPY
uncertainties in sound propagation, the inability to esti- mate the depths of fish aggregations, and the lack of corroborating biological data. This approach requires a very high SL, about 230 dB re 1 μPa rms, that may affect the behavior of both marine mammals and fish at long ranges from the source.
Interpretation of Bioacoustic Backscatter Spectroscopy Measurements and
Biological Attenuation
As mentioned in the Introduction, interpretation of bioacoustic backscatter spectroscopy (BBS) data is complicated by the fact that echo levels are affected not only by the TS of fish at a specified range but also by the effect of biological attenuation due to fish between the sonar and the specified range (Weston and Andrews, 1990), except when there are no fish between the sonar and fish at the specified range. The two lowest resonance frequencies, shown in Figure 3 (Nero et al., 1998; Stan- ton et al., 2010), were derived from BBS measurements at sites where there were no fish between the sonar and the targeted layers of fish. Duane et al.’s (2019) experi- ment at the resonance frequency of a species (possibly herring) showed that a spatially well-defined aggrega- tion of fish at short range, which moved in front of a spatially well-defined aggregation of fish at long range, dramatically reduced the magnitude of the echoes from the more distant aggregation. Qiu et al. (1999) conducted the only known concurrent measurements of attenuation and backscattering from fish at the resonance frequency of the fish. The attenuation coefficient peaked at the resonance frequency of dispersed Japanese anchovies (Engraulis japonicus), consistent with theoretical calcula- tions (Diachok and Wales, 2005), whereas backscattered levels exhibited a minimum, instead of the theoretically expected maximum, at the resonance frequency as a result of biological attenuation.
Bioacoustic Attenuation Spectroscopy
Experimental Approach
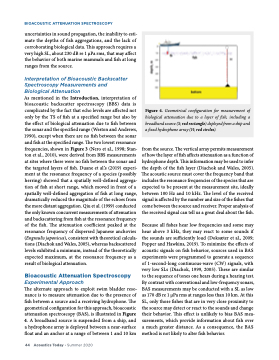
The alternate approach to exploit swim bladder reso- nance is to measure attenuation due to the presence of fish between a source and a receiving hydrophone. The geometrical configuration for this approach, bioacoustic attenuation spectroscopy (BAS), is illustrated in Figure 4. A broadband source is suspended from a ship, and a hydrophone array is deployed between a near-surface float and an anchor at a range of between 1 and 10 km
from the source. The vertical array permits measurement of how the layer of fish affects attenuation as a function of hydrophone depth. This information may be used to infer the depth of the fish layer (Diachok and Wales, 2005). The acoustic source must cover the frequency band that includes the resonance frequencies of the species that are expected to be present at the measurement site, ideally between 100 Hz and 10 kHz. The level of the received signal is affected by the number and size of the fishes that come between the source and receiver. Proper analysis of the received signal can tell us a great deal about the fish.
Because all fishes hear low frequencies and some may hear above 3 kHz, they may react to some sounds if the sounds are sufficiently loud (Doksæter et al., 2009; Popper and Hawkins, 2019). To minimize the effects of acoustic signals on fish behavior, sources used in BAS experiments were programmed to generate a sequence of 1-second-long continuous-wave (CW) signals, with very low SLs (Diachok, 1999, 2005). These are similar to the sequence of tones one hears during a hearing test. By contrast with conventional and low-frequency sonars, BAS measurements may be conducted with a SL as low as 170 dB re 1 μPa rms at ranges less than 10 km. At this SL, only those fishes that are in very close proximity to the source may detect or react to the sounds and change their behavior. This effect is unlikely to bias BAS mea- surements, which provide information about fish over a much greater distance. As a consequence, the BAS method is not likely to alter fish behavior.
Figure 4. Geometrical configuration for measurement of biological attenuation due to a layer of fish, including a broadband source (S; red rectangle) deployed from a ship and a fixed hydrophone array (H; red circles).
44 Acoustics Today • Summer 2020
