
Page 39 - Summer2022
P. 39
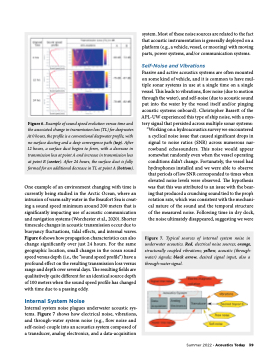
Figure 6. Example of sound speed evolution versus time and the associated change in transmission loss (TL) for deepwater. At 0 hours, the profile is a conventional deepwater profile, with no surface ducting and a deep convergence path (top). After 12 hours, a surface duct begins to form, with a decrease in transmission loss at point A and increase in transmission loss at point B (center). After 24 hours, the surface duct is fully formed for an additional decrease in TL at point A (bottom). One example of an environment changing with time is currently being studied in the Arctic Ocean, where an intrusion of warm salty water in the Beaufort Sea is creat- ing a sound speed minimum around 200 meters that is significantly impacting use of acoustic communication and navigation systems (Worchester et al., 2020). Shorter timescale changes in acoustic transmission occur due to buoyancy fluctuations, tidal effects, and internal waves. Figure 6 shows how propagation characteristics can also change significantly over just 24 hours. For the same geographic location, small changes in the ocean sound speed versus depth (i.e., the “sound speed profile”) have a profound effect on the resulting transmission loss versus range and depth over several days. The resulting fields are qualitatively quite different for an identical source depth of 100 meters when the sound speed profile has changed with time due to a passing eddy. Internal System Noise Internal system noise plagues underwater acoustic sys- tems. Figure 7 shows how electrical noise, vibrations, and through-water system noise (e.g., flow noise and self-noise) couple into an acoustics system composed of a transducer, analog electronics, and a data-acquisition system. Most of these noise sources are related to the fact that acoustic instrumentation is generally deployed on a platform (e.g., a vehicle, vessel, or mooring) with moving parts, power systems, and/or communication systems. Self-Noise and Vibrations Passive and active acoustics systems are often mounted on some kind of vehicle, and it is common to have mul- tiple sonar systems in use at a single time on a single vessel. This leads to vibrations, flow noise (due to motion through the water), and self-noise (due to acoustic sound put into the water by the vessel itself and/or pinging acoustic systems onboard). Christopher Bassett of the APL-UW experienced this type of ship noise, with a mys- tery signal that persisted across multiple sonar systems: “Working on a hydroacoustics survey we encountered a cyclical noise issue that caused significant drops in signal to noise ratios (SNR) across numerous nar- rowband echosounders. This noise would appear somewhat randomly even when the vessel operating conditions didn’t change. Fortunately, the vessel had hydrophones installed and we were able to observe that periods of low SNR corresponded to times when elevated noise levels were observed. The hypothesis was that this was attributed to an issue with the bear- ing that produced a crunching sound tied to the prop’s rotation rate, which was consistent with the mechani- cal nature of the sound and the temporal structure of the measured noise. Following time in dry dock, the noise ultimately disappeared, suggesting we were Figure 7. Typical sources of internal system noise in underwater acoustics. Red, electrical noise sources; orange, structurally coupled vibrations; yellow, acoustic (through- water) signals; black arrow, desired signal input, also a through-water signal. Summer 2022 • Acoustics Today 39
