
Page 67 - Summer2022
P. 67
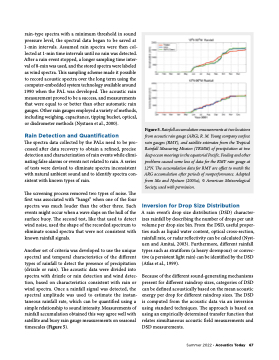
rain-type spectra with a minimum threshold in sound pressure level, the spectral data began to be saved at 1-min intervals. Assumed rain spectra were then col- lected at 1-min time intervals until no rain was detected. After a rain event stopped, a longer sampling time inter- val of 8-min was used, and the stored spectra were labeled as wind spectra. This sampling scheme made it possible to record acoustic spectra over the long term using the computer-embedded system technology available around 1990 when the PAL was developed. The acoustic rain measurement proved to be a success, and measurements that were equal to or better than other automatic rain gauges. Other rain gauges employed a variety of methods, including weighing, capacitance, tipping bucket, optical, or disdrometer methods (Nystuen et al., 2000). Rain Detection and Quantification The spectra data collected by the PALs need to be pro- cessed after data recovery to obtain a refined, precise detection and characterization of rain events while elimi- nating false alarms or events not related to rain. A series of tests were devised to eliminate spectra inconsistent with natural ambient sound and to identify spectra con- sistent with known types of rain. The screening process removed two types of noise. The first was associated with “bangs” when one of the four spectra was much louder than the other three. Such events might occur when a wave slaps on the hull of the surface buoy. The second test, like that used to detect wind noise, used the shape of the recorded spectrum to eliminate sound spectra that were not consistent with known rainfall signals. Another set of criteria was developed to use the unique spectral and temporal characteristics of the different types of rainfall to detect the presence of precipitation (drizzle or rain). The acoustic data were divided into spectra with drizzle or rain detection and wind detec- tion, based on characteristics consistent with rain or wind spectra. Once a rainfall signal was detected, the spectral amplitude was used to estimate the instan- taneous rainfall rate, which can be quantified using a simple relationship to sound intensity. Measurements of rainfall accumulation obtained this way agree well with satellite and buoy rain gauge measurements on seasonal timescales (Figure 5). Inversion for Drop Size Distribution A rain event’s drop size distribution (DSD) character- izes rainfall by describing the number of drops per unit volume per drop size bin. From the DSD, useful proper- ties such as liquid water content, optical cross-section, rainfall rate, or radar reflectivity can be calculated (Nyst- uen and Amitai, 2003). Furthermore, different rainfall types such as stratiform (a heavy downpour) or convec- tive (a persistent light rain) can be identified by the DSD (Atlas et al., 1999). Because of the different sound-generating mechanisms present for different raindrop sizes, categories of DSD can be defined acoustically based on the mean acoustic energy per drop for different raindrop sizes. The DSD is computed from the acoustic data via an inversion using standard techniques. The approach is based on using an empirically determined transfer function that relates simultaneous acoustic field measurements and DSD measurements. Figure 5. Rainfall accumulation measurements at two locations from acoustic rain gauge (ARG), R. M. Young company surface rain gauges (RMY), and satellite estimates from the Tropical Rainfall Measuring Mission (TRMM) of precipitation at two deep ocean moorings in the equatorial Pacific. Fouling and other problems caused some loss of data for the RMY rain gauge at 12°N. The accumulation data for RMY are offset to match the ARG accumulation after periods of nonperformance. Adapted from Ma and Nystuen (2005a), © American Meteorological Society, used with permission. Summer 2022 • Acoustics Today 67
