
Page 28 - Summer 2006
P. 28
A SPECTROGRAM FOR THE TWENTY-FIRST CENTURY
Sean A. Fulop
Department of Linguistics, California State University, Fresno Fresno, California 93740
Kelly Fitz
School of Electrical Engineering and Computer Science, Washington State University Pullman, Washington 99164
Just as World War II was breaking out in Europe in 1939, a prototype of a remarkable electrical device was being completed at Bell Telephone Laboratories, under the direction of Ralph Potter. This device was able to provide, on a strip of paper, a continu- ous running document of the Fourier spectrum of a sound signal as it changed through time. Because of the war it was kept under wraps, but its detailed construction and numerous applications were revealed to the sci- entific community in a series of papers published in the Journal of the Acoustical Society of America (JASA) in 1946,1,2 wherein it was called the Sound Spectrograph. The running spectral analysis that it output was termed a spectrogram.
The spectrograph has been record- ed in history as one of the most useful and influential instruments for acoustic signal processing. In particular, the fields of phonetics and speech commu- nication, which motivated the develop- ment of the machine, have been com- pletely transformed by its widespread adoption. Over the decades, the cum- bersome and delicate analog spectro- graph hardware was transformed into more robust digital hardware at first, and then as computers became general- ly more powerful, into the digital soft- ware incarnations most of us use today. The underlying principle of the spectro- gram has never changed; most applied acousticians who do time-frequency analysis are content to use software that in essence simulates the output that appeared 60 years ago in JASA (Fig. 1). Of what else in acoustics can the same be said? Do we use 60-year old micro- phones? Tape recorders? Loudspeakers?
Well, in truth, some of us have not been so content, but a more useful ana- lytical process has never been generally recognized. The rich area of signal pro-
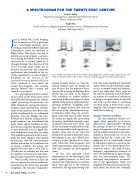
Fig. 1. Compare spectrograms of utterances [baeb], [daed], [gag] from a 1946 JASA paper2 (upper panel) to ones made in 2006 from the first author’s similar utterances, using the popular Praat sound analysis software.
cessing research known as “time-fre- quency analysis” grew up during the past 60 years. But the numerous varia- tions on the spectrogram that have been touted (one can think of the Wigner- Ville transform, or wavelet analysis) have never made much impact in many applied circles because of physical inter- pretation problems, readability prob- lems, or simply because they were not that much better. Time-frequency rep- resentations other than the spectro- gram, while they may be more precise for certain test signals like a pure chirp (frequency-modulated sinusoid), usual- ly provide unwanted “cross-terms” that do not correspond to physically or audi- torily interpretable sound (signal) com- ponents. Ones that do not have this problem do not look much better than a spectrogram in any case. Wavelet pro- cessing is better thought of as “time- scale” rather than “time-frequency,” and yields representations which are hard to read and interpret in spectrographic terms.
In fact, one especially useful improvement on the spectrogram (for many applied purposes, at least) was devised and implemented as software thirty years ago, but it was somehow drowned in the signal processing hub-
bub. Too many hopeful but ultimately useless efforts at time-frequency analy- sis left everybody jaded and defeatist, and it has taken these thirty years for the interest, invention, and mathemati- cal analysis of a number of researchers to bring us to a point where we can well and truly say that there is something out there which is better than a spec- trogram. The reassigned spectrogram is ready for its close-up.
Fourier’s timeless problem
The time-frequency analysis of a signal refers generally to a three- dimensional representation showing the passage of time on one axis, the range of frequencies on a second axis, and the amplitude found in each time- frequency intersection (or cell in the digital domain) on a third axis. The amplitude axis is traditionally shown by linking the values to a grayscale col- ormap over a two-dimensional time- frequency matrix. This kind of time- frequency representation attempts to show the distribution of signal energy over the time-frequency plane. The archetypal time-frequency representa- tion is the spectrogram, which was originally developed using analog elec- trical filters, but which was eventually
26 Acoustics Today, July 2006
