
Page 29 - Summer 2006
P. 29
represented mathematically as the magnitude of the short- time Fourier transform,3 a two-dimensional time-varying generalization of the Fourier transform.
Briefly put, for each time step of a signal, a spectrogram (Fig. 2) shows the decomposition of an analysis window into its Fourier spectral components as defined using the conven- tional Fourier transform.
This analysis produces a problem resulting from the inappropriateness of the Fourier transform’s formalization of the colloquial notion of “frequency” when a short analysis span is used in the spectrogram. A mathematical frequency defined using the Fourier transform does not correspond to our intuitive understanding of “frequency” unless the analy- sis span is infinite in time, and this negates the ability of a time-varying generalization of the scheme to tell us what we want to know about each short frame. For example, the Fourier spectrum of frequencies in a sine wave of infinite extent is indeed just the frequency of the sine wave which we would intuitively want (meaning, it is just exactly the back- and-forth rate of the oscillation), but when the sine wave is not infinite-time, the Fourier spectrum instead yields a band
Fig. 3. Fourier spectrum (green line) versus reassigned instantaneous frequency spectrum (blue points) of a two-component signal, both computed from a single Fourier transform over a 125 ms frame. The precise location of the 50 and 150 Hz sinusoidal components is shown by computing their instantaneous frequencies and reassigning points, but not by means of the Fourier frequency definition.
of frequencies surrounding and obscuring the intuitive fre- quency of the sine wave (see Fig. 3).
This so-called “smearing” in frequency affects the conven- tional spectrogram of Fig. 2, which is comprised of a sequence of Fourier spectra of successive short analysis windows of the signal. A mathematical duality within the transform induces a corresponding smearing in time, which may serve to obscure the true times of excitation of the various frequencies.
It is important to recognize that the frequency smearing that is so egregious in a short frame spectrogram is not a result of the uncertainty principle (shown by Denis Gabor4 to be analogous to the Heisenberg principle) which governs the duality between time and frequency, as this affects the resolv- ing power of the transform in the time and frequency dimen- sions. The smearing is a precision problem rather than a res- olution problem, and this is clear from the fact that even one purely sinusoidal signal component will be smeared in a con- ventional wideband spectrogram, whether or not we attempt to resolve it from anything else.
In speech analysis and many other applications, the investigator is frequently not interested in the time-frequen- cy energy distribution that the spectrogram provides, but is rather more interested in the instantaneous frequencies of the various amplitude-modulated (AM) or frequency-modulated (FM) sinusoidal components (often called line components) of a multicomponent signal. The instantaneous frequency5,6 is a suitable generalization of mathematical frequency that may change over time. Specifically, it is defined as the derivative of the frequency modulation function of a single line compo- nent—this degenerates formally to the intuitive frequency of an unmodulated sine wave, no matter how long or short that sine wave is.
The reason to switch our mathematical model of intu- itive “frequency” from Fourier’s definition to that of instan- taneous frequency is chiefly this: It seems increasingly like- ly that the human auditory system somehow pays attention to instantaneous frequency rather than the classical Fourier frequency. First, no one has reported that the auditory per-
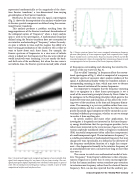
Fig. 2. Conventional (upper) and reassigned spectrograms of a pure double chirp signal, both computed using 15.6 ms frames, 156 μsec frame overlap. The reas- signed spectrogram displays amplitudes from red (loud) to blue (quiet) in spectral order. The increased precision of frequency tracking, is notable, in spite of visible computational artifacts and interference lines.
A Spectrogram for the Twenty-First Century 27
