
Page 31 - Summer 2006
P. 31
Applications of the reassigned spectrogram
The above explanations show that a goodly amount of reconceptualizing and unfamiliar new mathematical values are involved in the reassigned spectrogram, and applied researchers are going to want a big payoff in order to find all this worth while. Are we seriously going to toss aside the principles of Fourier analysis in favor of something new? The proof of the pudding is in the eating, so the chief justification for doing so is that we will then be better able to see and measure quantities of interest.
Speech sound analysis
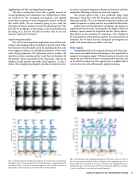
One of the most important application areas of this tech- nology is the imaging and measurement of speech sound. It has been found to be particularly useful for analyzing the fine scale time-frequency features of individual pulsations of the vocal cords during phonation. The phonation process involves the repetitive acoustic excitation of the vocal tract air chambers by the periodic release of air puffs by the vocal cords, which in an idealized model provide spectrally tilted impulses. As Fig. 4 shows, the reassigned spectrogram provides an impressive pic-
ture of the resonance frequencies (known as formants) and their amplitudes following excitation by each such impulse.
The speech signal in Fig. 4 was produced using creaky phonation, which has a very low frequency and airflow, and is thus quite pulsatile. This is to eliminate aeroacoustic effects and render the process as purely acoustic as possible for illustration.
Under more natural phonatory conditions, the process is significantly aeroacoustic, meaning that the higher airflow of ordinary speech cannot be neglected and has clearly observ- able effects on the excitation of resonances. The complexity of real phonation often militates against the measurement of formants, but we hope that the reassigned spectrogram can make such measurement possible, even easy.
Fishy signals
Gymnotiform fish of the tropical Americas and Africa pro- duce quasi-sinusoidal electrical discharges of low amplitude by
14
While not acoustic in nature, the signals are now believed to have a communicative function, and so the effective analysis of such signals poses a problem that is
means of a neurogenic organ.
very much in the vein of bioacoustic signal processing.
Fig. 5. Conventional and reassigned spectrograms of the same vowel as in Fig. 4, this time pronounced normally within an English word; computed using 5.9 ms frames. Note how the pattern of vocal tract excitations has changed from Fig. 4, although the same vowel is pronounced by the same speaker. Differences are large- ly due to the different voice quality of normal phonation.
Fig. 4. Conventional and reassigned spectrograms of several vocal cord pulsations during the vowel [e] ‘hay’ pronounced with creaky phonation; computed using 7.8 ms analysis frames. Vocal tract resonances appear as red or yellow excitations at each impulse, and they decay for some time before the next impulse.
A Spectrogram for the Twenty-First Century 29
