
Page 33 - Summer 2006
P. 33
vocal tract resonance frequencies are much easier to measure in the lower panel, where they are isolated, than in the upper spectrogram.
Summary
The reassigned spectrogram is a technique for analyzing sound and other signals into their AM/FM components, and showing the time course of the amplitudes and instantaneous frequencies of these components in a 3D plot. While similar in spirit to the 60-year old spectrogram which it improves upon, it embodies a fundamental departure from the time- worn efforts to show the complete energy distribution of a signal in time and frequency. In working to perfect the method as well as our understanding of the resulting images, the researchers who have contributed to this technology over the past 30 years—sometimes in ignorance of each other’s
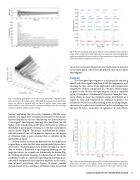
Fig. 7. Reassigned spectrograms of 70 Hz acoustic bass pluck, computed using a Kaiser window of 1901 samples at 44.1 kHz. Both the transient attack and the har- monics are able to be captured with one choice of analysis frame. Lower panel shows a different view of the same 3D scatterplot, making it clear how the ridges could be tracked for additive sound modeling.
Fig. 8. Here the reassigned spectrogram of Fig. 4 has been plotted to show only those points which are part of a nearly stationary line component, found using Nelson’s higher-order partial derivative condition. These points have a frequency derivative of the instantaneous frequency within 0.25 of 0.
Nelson16 explained that the nearly stationary AM/FM com- ponents of a signal have a frequency derivative of the instan- taneous frequency near zero. By plotting just those points in a reassigned spectrogram meeting this condition on the higher-order mixed partial STFT phase derivative to within a threshold, a spectrogram showing just the line components can be drawn (Fig. 8). The precise threshold can be empiri- cally determined, and will in practice depend on the degree of deviation from a pure sinusoid that is tolerable in the application at hand.
Nelson further asserted the dual fact that the impulses in a signal have a value for this same mixed partial phase deriv- ative near 1. By plotting just those points meeting this condi- tion to within a threshold, a spectrogram showing just the impulsive events in a signal can alternatively be drawn (Fig. 9). Plotting all points meeting the disjunction of the above conditions results in a denoised spectrogram showing quasi- sinusoidal components and impulses together, to the exclu- sion of most everything else. Figure 10 shows another demonstration of the usefulness of Nelson’s idea; the excited
Fig. 9. Here the reassigned spectrogram of Fig. 4 has been plotted to show only those points which are part of an impulse, found using Nelson’s higher-order partial derivative condition. These points have a value for the derivative within 0.25 of 1.
A Spectrogram for the Twenty-First Century 31
