
Page 29 - Fall 2006
P. 29
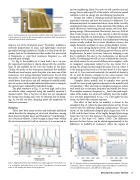
  Fig. 10. Instrumentation for measuring the mobilities (and mode shapes) of a plate. A grid of points is struck by the instrumented force hammer while acceleration is measured with the three accelerometers.
 and to neighboring fluids. For now, we will consider internal energy losses; and in part II of this article, will see how sound radiation is also an energy loss and damping mechanism.
Energy lost within a vibrating material depends on its molecular structure and how the material is deformed. The deformation leads to normal and shear strain fields (actually complicated strain tensors). Some materials, like rubbers, are more efficient at converting internal strains into heat, dissi- pating energy. Other materials, like metals, lose very little of their strain energy as heat. A key concept is that the energy dissipation depends on deformation, or displacement, which is contrary to the energy losses in the fundamental vibrating system usually studied first in basic vibrations courses: the simple harmonic oscillator, or mass-spring-dashpot system.
In a mass-spring-dashpot system, the damper dissipates energy proportional to the oscillating masses velocity, not its displacement. In most structures, however, damping is not due to dashpots, but due to the mechanisms we discussed earlier. The damping we will use here is defined by a loss fac- tor, which causes the structural stiffness to be complex—with its imaginary component related to the loss factor. For a spring, the spring constant simply becomes k(1+iη), where k is the spring constant and η is the loss factor (i is the square root of -1). For structural materials, the moduli of elasticity (E, G, and B) become complex in the same manner. For example, the complex Young’s Modulus becomes E(1+iη).
Complex elastic moduli lead to complex wave speeds
(recall the wave speed equations depend on the moduli) and
wavenumbers. They also lead to complex resonances, where
each mode has a resonance frequency and modal loss factor.
The complex resonance frequency ωmn limits the peak ampli-
tudes of the modes in a structure’s mobility since the mobili-
ty is inversely proportional to (ω 2-ω2). The higher the loss mn
factor, the lower the resonant response.
The effect of loss factor on mobility is shown in the
example in Fig. 12, where the glass plate shown in Fig. 10 was treated with two different damping configurations. The loss factors of the moderately damped plate range from 0.05 to 0.009, and the loss factors of the highly damped plate range from 0.012 to 0.015. For reference, the loss factor of untreat- ed glass is less than 0.01 (about 0.005). The difference between the loss factors can be related approximately to the difference in mobility at resonance, where the square of
 18
In Fig.11themobilityofa5mmthick1mx1msim- ply supported steel plate is shown, along with the contribu- tions to the mobility by the first few modes of the plate. Clearly, the peaks at the resonances dominate the mobility. Should any tonal source excite the plate at or near one of the resonances, very strong vibrations would ensue. In part II of this article, we will learn about how some mode types radiate sound better than others, and will combine the modal mobil- ities we see here with modal radiation efficiencies to compute the sound power radiated by individual modes.
The peak responses in Fig. 11 are very high, and in fact, are infinite when computed using the mobility equation I showed earlier. This is because we have not yet considered the energy lost during each cycle of vibration due to damp- ing. As we will see next, damping limits the amplitudes of modes at resonance.
Damping
There have been many articles and textbooks published
which describe the damping of structural vibrations, among
19 20 them those by Nashif, Jones, and Henderson and Beranek.
As a structure vibrates, it loses energy in many ways: within the structural material itself, to structures it is connected to,
shape is 1/4 of the total plate mass.
inversely proportional to mass, and lightweight structures generally have high mobilities. Finally, it is clear from the fre- quency term in the denominator that modes that are excited at frequencies ω near their resonance frequency ωmn will respond quite strongly.
Therefore, mobility is
  Fig. 11. Magnitude of drive point mobility of a simply supported 5 mm thick 1 m x 1 m rectangular steel plate driven at its center. Contributions of selected mode orders to the mobility are shown at low frequencies.
  Fig. 12. Example of how increasing damping reduces resonant response. Two glass 5 mm thick 0.304 m x 0.304 m square plates treated with different viscoelastic lay- ers have different loss factors, and different mobility peaks.
Structural Acoustics Tutorial 27
