
Page 28 - Fall 2006
P. 28
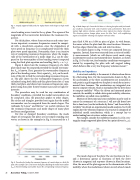
  Fig. 7. Simply supported (left) and free (right) beam mode shapes at high mode order.
  Fig. 9. Mode shapes of a 5 mm thick 0.304 m x 0.304 m glass plate with free bound- ary conditions, measured with a force hammer and accelerometers. Red colors indicate high relative vibration, and blue colors indicate low relative vibrations. The vibration pattern changes phase across the blue ‘lines’, with neighboring regions of red/yellow vibrating out of phase with each other.
 since bending waves travel in the xy plane. The square of the magnitude of the wavevector determines the resonance fre- quency.
For thick plates, where shear resistance and rotary iner- tia are important, resonance frequencies cannot be comput- ed with a closed-form equation, since the dependence of wave speed on frequency is so complicated (recall the thick plate wave speed equation). Fortunately, there is an iterative way of computing resonance frequencies, where the magni- tude of the wavenumber of a mode shape |kmn| can be com- pared to the wavenumber of free bending waves (computed using the thick plate equation and recalling that kb = ω / cb).
Figure 8 shows how the resonance frequency of a thick plate mode may be computed provided the modal wavenum- ber kmn is known. First, generate the wavenumber-frequency plot of free bending waves. Next, equate kmn to kb on the ordi- nate of the plot to find the corresponding resonance frequen- cy. The plot shows the free wavenumber-frequency curves calculated using both thick and thin plate theory for a 5 mm thick steel plate, and shows how resonance frequencies com- puted using thin plate theory become inaccurate at high fre- quencies.
The procedure may be used for any combination of boundary conditions, provided the modal wavenumber can be computed. Also, the procedure applies to other shapes, like circles and triangles, provided once again that the modal wavenumber can be computed from the mode shapes. The textbooks by Leissa12 and Blevins13 are useful references for the resonance frequencies and mode shapes of many plate and beam configurations.
For free or clamped boundary conditions, the mode shapes of rectangular flat plates are not simple standing sine waves, as shown in the examples in Fig. 9, measured for a 5
 mm thick 0.304 m x 0.304 m piece of glass. As with beams, the waves within the plate look like sine functions. However, the free edges vibrate like cosh and sinh functions.
The mode shapes in Fig. 9 were not computed from an equation. Instead, they were extracted from a series of mobili- ty measurements (which we will discuss next) made using accelerometers and an instrumented force hammer, as shown in Fig. 10. For this test, free boundary conditions were approx- imated by suspending the plate with soft surgical tubing,
14
A structure’s mobility is the amount it vibrates when driven by a fluctuating force. For the measurements shown in Fig. 10, the accelerations at the three accelerometers are measured as each point in a grid mapped over the plate is struck by an instru- mented force hammer. The accelerations are integrated over time to compute velocity, which is normalized by the drive force
15
the mobilities are called cross-mobilities.
Matrices of drive point and cross-mobilities may be used to
extract the resonances of a structure. I will not talk about how this is done here (see the textbooks by Ewins16 and the article by Avitabile17 for details on experimental modal analysis), but I will explain how the vibration response of a structure is composed of individual modal contributions, which is a concept key to understanding how structures radiate sound.
For example, consider the mobility at location (x,y) for a rec- tangular simply supported plate driven by a point drive at (xo, yo):
(22)
The mode shapes of the plate (the sin functions in the x and y directions) appear as functions of both the drive (shown in magenta) and response (shown in blue) locations. Also, the mass of the plate appears in the denominator of the mobility, where the modal mass (shown in red) of each mode
which behaves like a very low frequency isolation mount.
Mobility and impedance
When the driven and measured points coincide, the mobility is called a drive point mobility; otherwise,
to compute mobility.
 .
  Fig. 8. Procedure for finding the resonance frequency of a mode shape in a thick flat plate. The example is for a steel 5 mm thick plate. Matching the modal wavenumber kmn to the free bending wavenumber locates the corresponding resonance frequency.
26 Acoustics Today, October 2006
