
Page 13 - January 2007
P. 13
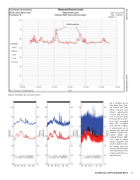
  Figure 3: State House lawn and Train Station
    Fig. 4. Halfway up the State House lawn, “look- ing” toward the Train Station, a bus pass event between approximately 1:12 p.m. and 1:13 p.m. Level vs. time over about 65 seconds, left ear of arti- ficial head, unweighted (blue) and A-weighted (red). The time resolution of measurements can be important. Left: Slow time weighting (1-second inte- gration). Middle: Fast weighting (125 ms). Right: 2 ms, similar to human auditory integration time for short-duration events. The average values are also given. The three peaks to the right of the bus event are due to a pile driver sev- eral blocks away.
Soundscape and Community Noise 11
