
Page 14 - January 2007
P. 14
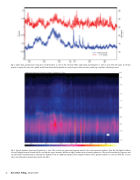
  Fig. 5. Same data, psychoacoustic measures: overall loudness vs. time in the unit Sone (blue, right scale) and sharpness vs. time in acum (red, left scale). As the bus passed, its engine fan noise was rapidly masked and unmasked by parked cars and the spaces between them, producing a rhythmic whooshing sound.
  Fig. 6. Specific loudness (spectrum of loudness) vs. time. The vertical axis represents frequency and the color scale represents loudness. Note that the highest loudness occurred roughly between 30 and 300 Hz, and that the region around 4 kHz has a higher loudness than at nearby frequencies. The ear discriminates by frequency and can often detect simultaneously a relatively low-loudness event at a different frequency than a higher-loudness event. Specific loudness vs. time can show this, in cases where overall loudness measurement masks the effect.
12 Acoustics Today, January 2007
