
Page 27 - January 2007
P. 27
There is a dichotomy between deep water and shallow water ambient noise, based largely on the nature of sound propagation from sources located near the sea surface. Deep water ambient noise is from an environment for which there is no bottom interaction of sound from distant sources (typ- ically commercial shipping). This occurs if there is a critical depth (also called a conjugate depth) at which the sound
8
speed is equal to the sound speed at the sea surface. A ray is
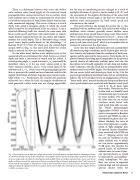
refracted following Snell’s law towards the water mass with lower sound speed, and those with small initial, or launch, angles become trapped between the sea surface and (approx- imately) the critical depth. This is illustrated using a sound speed versus depth profile based on the climatology9,10 at location 33.42o N 173.68o W, which puts the critical depth around 4000 m (Fig. 1). The noise level below the critical depth is reduced, but does not vanish altogether.
On the other hand, shallow water ambient noise is that associated with an environment for which there is no critical depth and there is interaction of sound with the seabed. A critical grazing angle, αc, equal to arccos(cw/cb) can usually be identified, where cw is the sea water sound speed at the water–sediment interface, and cb is the sound speed in the sediment and cb > cw. Sound rays with grazing angles greater than αc penetrate the seabed and are attenuated, and thus the angular distribution of distant shipping noise remains nomi-
11
Furthermore, for a seabed with moderate reflectivity (as is often the case), the angular distribution of wind-generated surface noise may not change appreciably,
nally within ± αc.
but the area of contributing sources enlarges as a result of multiple reflections. A typical αc for the seabed is 20–30o, and the association of the angular distribution of the noise field with the bottom critical angle is the basis for inversion of ambient noise measurements for both sound speed and
7,11
combined with an ambient noise field concentrated within a shallower water column, generally means shallow water ambient noise levels exceed those in deep water. How much? Wenz6 noted that shallow water noise levels are “...about 5 dB greater than corresponding deep water levels at the same fre- quency and same wind speed,” which is a reasonable value to assume for purposes of this discussion.
To be sure, this simple dichotomy does not accommodate all littoral and pelagic conditions, and it tends to gloss over dis- tinct acoustic environments from the standpoint of both prop- agation and the nature of the noise sources. Nevertheless, let us proceed towards describing typical magnitudes for the pressure spectral density of underwater ambient noise, and take this description to be broadly applicable to both deep and shallow water conditions, with the caveat that on average shallow water ambient noise levels will be higher. Our description consists of the two curves (solid, and dashed gray lines) in Fig. 2 for the pressure spectral density of ambient noise that are assembled as follows. The curve of higher level is an amalgamation of Wenz’s “heavy traffic noise” spectral density plus the spectral density of wind-speed related noise associated with Beaufort wind speed
scale 8 or 34–40 knots (gale
6
forcewinds). Notethatseastate
is often used as a broadly based
environmental input parameter
for noise models, even though
the noise from the sea surface
correlates much better with
wind speed than with sea state.
The World Meteorological
Organization (WMO) sea state
code 6 corresponds to Beaufort
scale of 8, and WMO sea state 0
corresponds to glassy calm con-
ditions. Similarly, the curve of
lower level represents a combi-
nation of “light shipping” plus
the spectral density of ambient
noise associated with WMO sea
12
state 0. Shipping activity and
sea state are combined in this rather artificial way to obtain our two curves, approximately 25 dB apart, that describe the general nature of underwater ambient noise in terms of pres- sure spectral density, as would be measured by an omnidirec- tional hydrophone. We take these two curves to represent nominal high and low pressure spectral density levels for
attenuation in the seabed.
The more reflective the bottom the greater the αc; this
Fig. 1. Illustrating the critical depth for a pelagic environment. (a) Sound speed versus depth based on climatology at 33.42o N, 173.68o W (see Refs. [9,10]). In this example the critical depth is 4000 m and the sound speed here equals the sound speed at the sea surface and is less than the sound speed at bottom depth (5000 m). (b) Rays launched from a source near the sea surface will refract towards the water mass with lower sound speed. Rays with launch angle greater than 7o will intersect the bottom and do not propagate to long distances owing to bottom attenuation (one such ray is shown). Sound from distance shipping is effectively trapped between the sea surface and the critical depth. The clustering of rays at quasi-regular intervals is called a convergence zone.
Underwater Ambient Noise 25
