
Page 30 - January 2007
P. 30
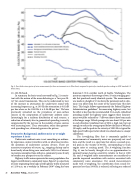
  Fig. 3. One-third-octave spectra of noise measurements for three environments in air (blue lines), compared to spectra for standard speech according to ANSI standard 3.5 (black lines).
 10–100-Hz band.
In summary, the basic trend conveyed by Fig. 2 is consis-
tent with the notion of the ocean behaving as a “low pass fil- ter” for sound transmission. This can be understood in view of the increase in attenuation for underwater sound with increasing frequency, e.g., at 100 Hz the attenuation is 0.02 dB
1
per km where as for 1000 Hz it is 0.06 dB per km. We have
previously remarked on the prevalence of near-surface sources in the composition of underwater ambient noise. Interestingly, for a uniform distribution of such sources, a reduction of intensity due to geometrical spreading is exactly compensated by the increase in the number of noise sources
7
with increasing area. Thus, attenuation, rather than geomet-
rical spreading loss, ultimately governs the picture.
Perspective: Background, ambient noise as we might experience it in air
Underwater ambient noise is not something we ordinar- ily experience, unless it interferes with, or otherwise involves, the operation of underwater acoustic devices. There are numerous exceptions of course, e.g., snapping shrimp can be heard easily when diving near coral reefs. Still, it is of interest to examine examples from airborne, community noise if only to broaden our perspective on the subject.
Highway traffic noise represents for many populations the largest contribution to community noise. Figure 3 is a spectrum of noise originating from high-speed highway traffic measured at 11:00 a.m. on a weekday in February 200639 along the busy
 Interstate-5 (I-5) corridor north of Seattle, Washington. The spectrum represents the average of two, 10-min averaging peri- ods that produced nearly identical spectra. The measurement was made at a height of 1.5 m above the pavement and at a dis- tance 4 m offset from the center of the nearest lane (the slow lane). This height follows approximately the Federal Highway Administration guidelines40 for measuring highway noise, but the offset is less than the recommended 15 m, and a cylindrical spreading model2 for highway noise suggests these measure- ments would be reduced by ~7 dB were they to have been made at the longer range. Vehicle passage rate was about 100 per min in each direction (combined rate of 200); a high rate, but not enough to reduce the average speed below the limit of 96 km/h (60 mph), and the peak in the vicinity of 1000 Hz is typical for high speed traffic spectra for which tire-related noise is a major contributor.
The A-weighting filter that is commonly applied to measurements of community noise was purposely not used here, and the result is a spectrum that shows a second spec- tral peak in the vicinity of 80 Hz, corresponding to truck engine noise at cruising speed. The A-weighting function (Fig. 4) can be loosely thought of as an approximation to nominal human hearing sensitivity, relative to that at 1000 Hz, and A-weighted noise measurements are considered to provide improved correlation with metrics associated with community noise annoyance. For sound measurements made with A-weighting, the contribution from sound fre- quencies less than 1000 Hz is reduced, reflecting our reduced
28 Acoustics Today, January 2007
