
Page 16 - Summer 2007
P. 16
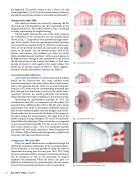
 ply duplicated. The model is shown in Fig. 4. Source, A1, and receiver positions, 01 and 02, for the measurement session are also shown (see previous section on “Acoustical measurements”).
Geometrical model 1895
The earlier era model was created by replacing the flat floor and rear wall (installed in the 1912 renovation) by the original architecture. The model is shown in Fig. 5, including a surface representing the original seating.
During model construction, one of the main resources for verification of the architecture was the singular photo shown in Fig. 3. Comparisons were possible through render- ings of the model, where the approximate camera position was recreated (see example in Fig. 6). While the camera prop- erties are not perfectly recreated, one can make certain judg- ments on the model. The red shaded surfaces, back of the lunettes and between the windows, are those on which Sabine installed acoustic treatment. Certain aspects appear to be slightly in error, though are not considered crucial, such as the tip intersection of the lunettes and dome. A final com- parison of interest is with regard to the room volume. The
3
model has an interior volume of 2632 m . This is approxi-
mately 4% smaller than Sabine’s estimate (see Table 1).
Acoustical model calibration
Aside from the collection of architectural and anecdotal details on the lecture-room, this study includes actual acoustical measures in the room (albeit after several renova- tions). The approach for this study was to work backwards, from the 1972 room with the corresponding measured data back through the renovations to arrive at the earlier states. Agreement between the model predictions and measure- ments should provide some confidence in the reconstruction.
Replicating the measurement positions of 1973, the reverberation time (RT) was compared with the model. The measured data exhibited a dip in RT at 500 Hz. Some minor adjustments were made to absorption coefficients (particu- larly for the ventilation grilles near the skylight) and the dif- fusion coefficients (to account for the debris of the canopy on the floor during the measurements). The final state of the model using ray tracing techniques (T15 and T30) and tradi- tional Sabine Reverberation Time calculation are compared to the measured data (typically T15 due to low S/N ratios), with results shown in Fig 7. The T15 calculation matches extremely well, with small variations at lower frequencies for T30. Sabine’s diffuse field prediction equation is slightly less consistent with the measurement results.
Comparison 1895 and 1898
Using the model characteristics established through the calibration procedure (refinement of the acoustical proper- ties of materials), it was now possible to undo the series of renovations occurring over the time span 1910–1973. Using the pre-renovation models, numerous acoustical parameters can be predicted, as well as the generation of impulse responses for auralization. While the latter is the goal, it is difficult to include them in a printed article. For that reason, several of the acoustical parameter results are presented.
  Fig. 4. Acoustical model, 1972.
  Fig. 5. Acoustical model, 1895.
  14 Acoustics Today, July 2007
Fig. 6. Interior view of acoustical model, 1985.
