
Page 34 - Summer 2007
P. 34
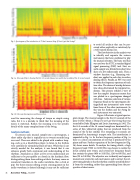
  Fig. 1. Spectrogram of the introduction to “It don’t mean a thing (if it ain’t got that Swing).”
 to avoid all artifacts that can be per- ceived either explicitly or intuitively by a well trained human ear.
The first objective in the analysis was to identify and separate the various instruments that have combined to play the musical selection. The basic tool that was used was the STFT, a standard digital signal processing (DSP) tool. First, an audio sample was divided into short time slices of a few milliseconds each. Then a window function (e.g., Hamming win- dow) was applied to each slice to reduce aliasing effects. Finally, an FFT was used to obtain the frequency spectrum of each time slice. The choice of overlap between time slices determined the temporal res- olution. This process yielded a view of how the sample's frequency content that was plotted in a spectrogram changed with time. Judicious selection of various frequency bands in the spectrogram dis- tinguished one instrument's note events from those of the other instruments. In this way the rhythm and the Swing for each instrument was extracted.
Figure 1 illustrates a typical spectro- gram image. The musical sample is the first 19 seconds of the piece It Don't Mean a Thing (if it ain't got that Swing) that was recorded by Duke Ellington and Louis Armstrong in 1962. The first 4.5 seconds of the 19 second sample are dominated by a series of thin yellow/red spikes that are produced from the sound of the hi-hat cymbal. The remaining 14 seconds are dominated by Armstrong's trumpet solo. The introduction is expanded in Fig. 1a. In the low frequency portion of Fig. 1a there is a dense concentration of red that is produced by the piano and bass. Further expansion of the low frequencies (Fig. 1b) shows more details. To analyze the timing details, a high frequency band (7500 to 22,000 Hz) was chosen to isolate the hi-hat cymbal note events, and several low frequency bands that contain the piano (850 to 1020 Hz), (240 to 850 Hz), and bass (20 to 240 Hz). The objective was to identify and separate musical note events for each instrument, and to extract the rel- ative timing details so that the rhythm could be specified direct- ly from the recording, rather than approaching from the per-
spective of sheet music.
   Fig. 1a. Close-up of Fig. 1 showing the first 4.5 seconds (piano, bass and hi-hat cymbal) of the 19 second sample.
 Fig. 1b. Close-up showing piano and bass portion.
 used for measuring the change of tempo or simple swing ratio, but it is a mistake to think that the meaning of the music is statistical. Rather, the meaning is in the specific details of the many complex forms of the Swing.
Analysis methods
To process each musical sample into a spectrogram, a short audio clip that is typically ten to twenty seconds long was used. These are edited to be played with seamless loop- ing, such as in a QuickTime player, to listen to the rhythm very carefully for extended periods of time. While this is not strictly needed for the analysis, it was found that it can enhance greatly both enjoyment and understanding of the rhythms. Anomalies as short as five or ten milliseconds are sufficient to be perceptible as a break in the rhythmic flow, distinguishing them from editing artifacts that may cause an unnatural transition in the audio waveform, like a click or pop. For these reasons editing at zero crossing points in the audio waveform is desired although it may not be sufficient
32 Acoustics Today, July 2007
