
Page 42 - April 2008
P. 42
HOW TO ASSESS HEARING PROTECTION EFFECTIVENESS: WHAT IS NEW IN ANSI/ASA S12.68
William J. Murphy
National Institute for Occupational Safety and Health Cincinnati, Ohio 45226-1998
In July 2007, the Acoustical Society
of America published ANSI/ASA
S12.68 American National
Standard Methods of Estimating
Effective A-Weighted Sound Pressure
Levels When Hearing Protectors are
1
Worn. The standard is an advance rel-
ative to the Noise Reduction Rating (NRR) as currently mandated by the U.S. Environmental Protection Agency and it is also an advance relative to the standards that have been developed by the International Organization for Standardization (ISO). Since the promulgation of the EPA’s hearing protection labeling rule in 1978, the Noise Reduction Rating has been criticized as overestimating the
2 performance that users achieve in the workplace. The NRR
attenuation data are measured with subjects who have had the hearing protection fitted solely by the experimenter. ANSI/ASA S12.68 standard utilizes attenuation data that are derived from subjects who have either minimal experi- ence with hearing protection and protector testing or with subjects who have been trained by the experimenter. Let us examine the novel techniques contained within the ANSI/ASA S12.68 standard.
First, the standard provides three methods of estimating the performance of a protector based upon the attenuation measurements for that device. The first method is a two-num- ber Noise Reduction Statistic for A-weighting (NRSA) which informs the user about the lower and upper range of perform- ance that can be expected from the hearing protector. To uti- lize the NRSA, the user need only measure the A-weighted noise exposure and then subtract the rating to estimate the exposure. Use of the lower number provides a conservative estimate of the exposure that most users will not exceed when wearing the device. Use of the higher number can provide an estimate of whether the protector may give one too much pro- tection and potentially lead to impaired communication in a noisy environment. The range between the two ratings pro- vides a more subtle indication about the use of the product. If the upper and lower numbers are relatively close together, this gives an indication that the protector was consistently fit across the test panel and that variation in performance across differ- ent noise spectra is small. Research studies have shown that varied performance across users was the single most important factor in how much attenuation one received while wearing the protector (in addition to whether it is worn whenever you enter the noisy environment).
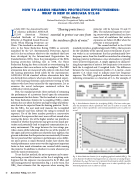
To use the first method, the noise exposure can be meas- ured using a sound level meter set for the A-weighting scale. Suppose that the exposure was measured to be 97 dBA, and the hearing protector represented in Fig. 1 is to be worn. The NRSA then estimates that the exposure when wearing this
“Hearing protection is essential to protect our ears from the insidious effects of noise.”
protector will be between 78 and 70 dBA. The industrial hygienist or hear- ing conservation professional can have some level of confidence that worker exposures are below 85 dBA when the protector is worn properly.
The second method in the S12.68 standard provides a graphical approach (NRSG) that accounts for the variability of the spectral noise environment. If a per- son works in an environment that has predominantly low- frequency noise, then this should be considered in estimating hearing protector performance, since attenuation is typically worse at lower frequencies. A simple approach to character- izing the proportion of noise at low frequencies is to measure both the A-weighted and C-weighted levels. The difference between the two measurements yields a C-A metric—more positive C-A values tend to indicate more low frequency exposure. The NRSG graphical method provides two curves indicating attenuation as a function of C-A. For example, if
Fig. 1. Noise Reduction Statistic for A-weighting (NRSA). The lower value repre- sents the attenuation which is possible for most users to achieve or exceed. The upper value is what is possible for a few motivated proficient users to achieve or exceed.
40 Acoustics Today, April 2008
Fig. 2. Noise Reduction Statistic for A-weighting graphical method (NRSG). The curves illustrate the effective hearing protection as a function of varying the spec- tral balance (LC-LA). The lower curve represents the attenuation which is possible for most users to achieve or exceed. The upper curve is what is possible for a few motivated proficient users to achieve or exceed.
