
Page 43 - April 2008
P. 43
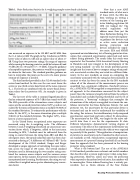
Table 1. Noise Reduction Statistic for A-weighting sample octave band calculation.
   Now that a new ANSI standard exists, of what use is it? Since 2003, the EPA has been working on writing a revision of the hearing pro- tector labeling regulation (40
2
CFR 211 Subpart B). The
revised regulation will address more than just the Noise Reduction Rating. It is expected to provide regulato- ry guidance for devices such as active noise reduction hearing protection and devices intended for impul- sive noise. EPA and NIOSH
sponsored an interlaboratory test of hearing protector atten- uation that compared experimenter-supervised and naïve subject fitting protocols. The results from this study were reported at the December 2006 Acoustical Society Meeting in Honolulu and were integral in the development of the
5
new rating standard. As well, the results provided greater
insight into the issues of how to compare ratings when prod- ucts are retested or when they are tested in a different labo- ratory. In the new standard, an annex on computing the uncertainty associated with the rating has been included. In contrast to what has been the norm for the ISO standards where all of the elements of the measurement process are quantified (e.g., equipment calibration, threshold variance, etc.), ANSI/ASA S12.68 has applied a computational statisti- cal approach to the attenuations measured for the subject panel. Since the variance is largely derived from the subject’s unoccluded and occluded hearing thresholds and the fit of the protector, a “bootstrap” technique that resamples the attenuations of the subjects was applied to estimate the con- fidence interval for the Noise Reduction Statistic. For each protector test, the uncertainty for that particular device is estimated and can be used to understand the variability of the rating. For instance, the interlaboratory study compared experimenter-supervised and naïve subject fit attenuations. The uncertainty on the NRSA was larger for the naïve sub- ject-fit data than it was for the experimenter fit data. Different laboratories demonstrated varying degrees of uncertainty. The effect of the experimenter involvement was seen in reduced uncertainty when the subjects were required to precisely fit the product. This application of computation- al statistics to uncertainty can be translated to other acousti- cal standards as well. Sound power, occupational exposure, measurement of a person’s hearing threshold all can benefit from the approach that has been pioneered in the hearing protector rating standard.
What is the bottom line? The use of the ANSI/ASA S12.68 method provides more relevant and useful numbers that describe what a person might expect when using hear- ing protection. However, unless one wears the protection when exposed to hazardous levels of noise, the numbers will be meaningless. Noise-induced hearing loss is entirely pre- ventable. Just as Norm Abrams of the New Yankee
 one measured an exposure to be 100 dBC and 92 dBA then the C-A value is 8 dB. The graph in Fig. 2 indicates an NRSG lower value of about 12 dB and an upper value of about 17 dB. Using these two protector ratings, the range of exposure while wearing the hearing protector could be between 80 and 75 dBA \[92-12= 80 and 92-17 = 75 dBA\]. Using the guidance of acceptable exposures, the protector would be an appropri- ate choice for that noise. The standard provides guidance on how to interpolate the points on the curve if a more precise estimate of exposure is needed.
The third method provided in the S12.68 standard is the octave-band method. In this case the user must know the octave or one-third octave-band levels of the noise exposure (Lf ). The levels are combined with the octave-band attenu- ation values for the protector (Af). An example is given in Table 1.
The last row of the table is summed logarithmically to find an estimated exposure of 79.7 dBA that rounds to 80 dB. The 80th percentile of the attenuations across subjects and noises are the assumed protection values (APV80) and are cal- culated by the mean attenuation minus a multiple (0.8416) of the standard deviation. To estimate the performance with the better fit, the APV20 is the mean attenuation plus a multiple (0.8416) of the standard deviation. The higher APV80 trans- lates to a lower exposure level.
In the United States, occupational noise exposures are measured using the A-weighting scale. The difference between C and A weighting introduced an unnecessary con- version factor which, if forgotten, added to the inaccuracy. According to EPA, 7 decibels must be subtracted from the rating to convert between the rating from dBC and dBA. In subsequent years, the typical industrial noise has been char-
3,4
In the development of the S12.68 standard, Gauger and Berger developed a unique approach of calculating the noise reduc- tion across the range of 130 noises. The overall standard deviation used in determining the two-number rating com- bined the variance across subjects and the variance across noise spectra. In this manner, the spectral variation is already incorporated into the rating. Furthermore, the rating was cal- culated for A-weighted noise spectra eliminating any conver-
sion factor.
acterized as having a C-A difference of 5 dB and 3 dB.
Hearing Protection Effectiveness 41
