
Page 29 - Spring 2009
P. 29
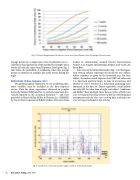
   Fig. 2. Chance of being awakened at least once versus event Sound Exposure Level for multiple, like-noise events
average person by a single noise event (acclimated curve— solid line), then application of this method for multiple noise events (all with the same Sound Exposure Level) gives Fig. 2 that shows the probability of awakening when this average person is subjected to multiple, like-noise events during the night.
Refinement of dose-response curve
By applying logistic regression to raw awakening data, more variables may be included in the dose-response curves. Data for these regressions, obtained in people’s homes by Sanford Fidell and his co-workers, have been pre- viously reported in the acoustical literature,3,4,6,7 and were provided to Harris Miller Miller & Hanson Inc. (HMMH) by the Air Force’s sponsor of Fidell’s studies. Data were from
studies in communities around Denver International Airport, Los Angeles International Airport, and Castle Air Force Base.
Data were of the form illustrated in Fig. 3. In this figure, each vertical column represents the results for one subject; subject numbers are given on the horizontal axis. For each subject, the indoor sound exposure level (SEL) of each event (i.e., how loud and how long), its time of occurrence, and whether or not it resulted in a behavioral awakening were contained in the data set. Hence regressions could include not only SEL, but also time of night and subject. (Anderson and Miller12 have analyzed these data in terms of both time since retiring and individual sensitivity but the ANSI Standard incorporates only the time since retiring data, and only time since retiring is included in this article.)
  28 Acoustics Today, April 2009
Fig. 3. Aircraft noise events experienced by subjects at Denver International Airport.
