
Page 31 - Spring 2009
P. 31
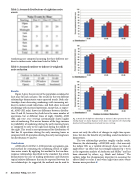
 Table 2: Assumed distributions of nighttime noise events
Awakenings are computed assuming the three different out- door-to-indoor noise reductions listed in Table 3.
Table 3: Assumed outdoor-to-indoor (A-weighted) noise reduction
Results
Figure 5 gives the percent of the population awakened at least once for each scenario. The results for the two different relationships demonstrate some expected trends. Both rela- tionships show decreasing awakenings with increasing out- door-to-indoor sound reductions, and both show increased awakenings with increased operations, except that, as expect- ed, ANSI (SEL only) shows no difference between distribu- tion #2 and #3, because they both have the same number of operations, but at different times of night. Notably, ANSI (SEL and time since retiring) systematically shows higher rates of awakening. This occurs because of the large increase in probability of awakening during the early morning hours as compared to early in the night and during the middle of the night. This trend is most pronounced for distribution #3 that has 35 operations during the early morning hours as compared with 20 operations during the early morning hours for distributions #1 and #2.
Conclusions
ANSI/ASA S12.9/Part 6–2008 provides a pragmatic gen- eral method for estimating the awakening effects of night- time noise events. By applying this method to the two dose- response relationships described in the standard, this article demonstrates the ease of making predictions and illustrates typical relative differences that can be expected between the two relationships. As suggested, the methods can be used to
    assess not only the effects of changes in night-time opera- tions, but also the benefits of providing sound insulation to homeowners.
The two relationships produce roughly similar results. However, the relationship—ANSI (SEL only)—that uses only the indoor SEL as a variable obviously shows no time-of- night effect—an effect that was strongly indicated (p < 0.01) in the regression analysis of Anderson and Miller,12 and has
13
been observed by others, e.g., Brink and Schierz. The
authors judge this phenomenon important in assessing the effects likely to occur if and when night-time noise events become more prevalent.AT
30 Acoustics Today, April 2009
Fig. 5. Results for the different relationships as indicated. Blue represents the rela- tionship based on Sound Exposure Level alone; red represents the relationship based on both Sound Exposure Level and time since retiring.
