
Page 10 - Winter 2009
P. 10
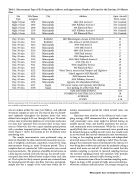
 Table 1. Measurement Types, File Designation, Address, and Approximate Number of Events for the Daytime, 30-Minute Sites
Site
File Name
City
Address
Aprx. Aircraft
Type
Assigned
Event Count
Night; 9-hour
2002
Minneapolis
4849 13th Avenue S
Not Counted
Night; 9-hour
2003
Minneapolis
4525 Pillsbury Avenue S
Not Counted
Night; 9-hour
2004
Minneapolis
300 Elmwood Place
Not Counted
Night; 9-hour
2103
Minneapolis
4525 Pillsbury Avenue S
Not Counted
Night; 9-hour
2104
Minneapolis
300 Elmwood Place
Not Counted
Day; 30-min
3211
Richfield
6800 Bloomington Avenue @ 69th Street E
12
Day; 30-min
3112
Richfield
11th Avenue S @ 65th Street E
11
Day; 30-min
3214
Minneapolis
3030 53rd Street E
25
Day; 30-min
3115
Minneapolis
1700 49th Street E
9
Day; 30-min
3116
Minneapolis
4849 13th Avenue S
5
Day; 30-min
3117
Minneapolis
5300 Park Avenue
17
Day; 30-min
3118
Minneapolis
5201 Hampshire Dr
17
Day; 30-min
3119
Minneapolis
4901/4905 Oakland Avenue S
18
Day; 30-min
3120
Minneapolis
4725 27th Ave S
13
Day; 30-min
3121
Minneapolis
4644 Longfellow Avenue
23
Day; 30-min
4151
Minneapolis
300 Elmwood Place
14
Day; 30-min
4152
Minneapolis
Water Tower; intersection Prospect and Highview
15
Day; 30-min
4153
Minneapolis
School opposite 5825 Blaisdell
14
Day; 30-min
4154
Minneapolis
4905 Emerson Avenue
11
Day; 30-min
4155
Minneapolis
4525 Pillsbury Avenue S
10
Day; 30-min
4156
Minneapolis
opposite 401 Minnehaha Parkway
12
Day; 30-min
4157
Eagan
SW corner tennis court opposite 1428 Skyline
22
Day; 30-min
4158
Eagan
near parking lot at Bur Oaks Park
11
SUM DAYTIME EVENTS
259
NUMBER OF DAYTIME LOCATIONS
18
AVERAGE
14.4
ST DEV
5.18
 Data for measurements 3111, 3113, and 3114 were incorrectly gathered. Data sets 3211 and 3214 are correctly gathered replications at these two sites. There was insufficient time available to replicate the measurements at site 3113.
                                  sites at random within this zone (see Table 1), and collected 30-minute samples at each site. The time of day was distrib- uted randomly throughout the daytime hours that were defined to be roughly 9:00 a.m. through 6:00 p.m. We exclud- ed sites close to interstate highways or very major roads since it is clear that “quietude” does not exist close to these noise sources. Otherwise, this was a quasi-random spatial pattern with a random temporal pattern within the daytime hours stated. Figure 1 shows the location of the 18 daytime noise monitoring sites.
The sample measurements were performed using an observer. Basically, the data consisted of consecutive one-sec- ond, A-weighted, continuous, equivalent, sound levels (Leq) measurements during an entire 30-minute period. Thus, a complete data set consisted of 1,800 consecutive one-second Leq measurements. The presence of audible aircraft noise on a data log was marked, and with this log, the aircraft-noise- corrupted data were deleted before analysis from each data set. The Leq for the thirty-minute period was estimated from the remaining aircraft noise–free data. Our time- and spatial- sample also was a sample of the total time within the 30-
minute measurement period for which aircraft noise was inaudible.
Questions were raised as to the efficacy of such a sam- pling strategy. MSP commented that a significant non-air- craft community noise event might be deleted during an audible aircraft event, and thereby understate the non-air- craft community noise environment. While this is true, it is equally likely that a very quiet community noise period may be deleted during an audible aircraft event; this would result in an overstated non-aircraft community noise environment. As long as the sampling period is random and independent of aircraft noise events, this sampling is valid. Thus, the sam- pling of the community noise environment is the same as if it were being done without aircraft noise by randomly cycling a sound level meter on and off. (It should be noted that this random sampling is superior to metered sampling because the metered sampling period will modulate with periodic noise events such as metered traffic skewing results.)
As a demonstration of how the random sampling works, Figure 2a shows 1,800 seconds of traffic noise recorded else- where for a different judicial matter. The energy-average Leq
Minneapolis Sues its Airports Commission 9
