
Page 18 - Spring 2010
P. 18
KRAKATOA AND THE ROYAL SOCIETY: THE KRAKATOA EXPLOSION OF 1883
Thomas B. Gabrielson
Applied Research Laboratory, The Pennsylvania State University State College, Pennsylvania 16804
“The barograph in Glasgow recorded seven passages: at 11 hours, 25 hours, 48 hours, 59 hours, 84 hours, 94 hours, and 121 hours (5 days) after the eruption.”
On 27 February 2010, a magnitude collection of geophysical observations
8.8 earthquake struck near the
coast of Chile. Media coverage
was immediate and intense, focusing not
only on local destruction but also on the
tsunami launched across the Pacific
Ocean. Coastal areas of Hawaii were evac-
uated and television cameras swept the
beaches hoping (but failing) to capture
landfall of a monster wave. Less glam-
orous was the network of National Data
Buoy Center (NBDC) ocean buoys that
can be accessed in nearly real time through the internet. Buoy 43412, in the Pacific about 400 km southwest of Manzanillo, Mexico, showed the tsunami’s passage as a 0.1 meter rise and fall over 20 minutes, superimposed on the normal tidal variation in ocean height. The tsunami passed this buoy almost 10 hours after the earthquake. (At least one television network showed output from an NDBC data buoy; however, the graphic actually showed a data glitch of greater than 10 meters in height rather than the much smaller tsunami signature. Easy access to data is a double-edged sword.) We take global and immediate access to data for granted. Immediate access is recent; however, global observations have been important much further back.
On 27 August 1883, the island of Krakatoa was virtually destroyed by an immense volcanic explosion. The resulting pres- sure wave was recorded worldwide for days afterward and is one of the most frequently-cited acoustical events of global propor- tion. Observations of the pressure wave from the explosion were not restricted to one or two locations; more than 50 weather sta- tions around the world recorded the wave’s passage. Several sta- tions recorded as
many as seven pas- sages as the wave orbited the globe. Photographic and pen-and-ink recordings of baro- metric pressure were forwarded to London and the ini- tial analyses were reported in a pair of papers, one by R. H. Scott and one by Lt. Gen. R. Strachey, in December, 1883.
In January of 1884, the Royal Society of London commissioned a
1
related to the Krakatoa eruption. Shortly thereafter, the investigations of the Royal Meteorological Society were merged with those of the Royal Society and the Krakatoa Committee of the Royal Society (Symons, 1888) was formed.
Clearly, the explosion’s pressure wave was a remarkable, global phenomenon. About 4 hours after the explosion, the pressure pulse appeared on a barograph in Calcutta. In 6 hours, the pulse reached
Tokyo; in 10 hours, Vienna; and in 15 hours, New York. After converging through the antipodal point near Medellin, Columbia, the wave was seen again in New York 23 hours after the explosion; in Vienna again at 26 hours; in Tokyo again at 31 hours; and in Calcutta again at 32 hours. The barograph in Glasgow recorded seven passages: at 11 hours, 25 hours, 48 hours, 59 hours, 84 hours, 94 hours, and 121 hours (5 days) after the explosion.
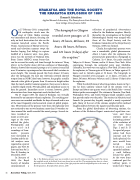
While the distribution of observing stations shown in Fig. 1 was far from uniform—almost half of the stations were in Europe and about one quarter were in the British Isles—several distinct paths were sampled. The stations in Toronto, New York, Washington (DC), and South Georgia Island sampled a path that passed nearly over the poles. The stations in Mauritius and Luanda (in present-day Angola) sampled a nearly equatorial path. Many of the rest of the stations sampled orbits inclined roughly midway between the equator and the polar path.
From the global distribution of observing stations, the authors of the Krakatoa Report constructed equal-time con- tours and these contours paint a fascinating picture2 of the evolution of the wave front (Figs. 2 and 3). If the speed of propa- gation had been constant and the Earth spherical, the wave would have started from Krakatoa and expanded uniform- ly until halfway around the globe. As the wave front continued past the halfway point, it would have begun
Fig. 1. The Krakatoa pressure wave was recorded at more than 50 stations around the world. The stations that supplied records to the Royal Society are shown here as red dots. The map projection above is a hemi- spherical view with Krakatoa at the center of the right projection and the antipodal point at the center of the left projection. Re-drafted from Symons, 1888.
14 Acoustics Today, April 2010
