
Page 19 - Spring 2010
P. 19
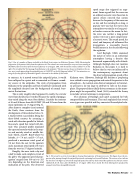
  Fig. 2. One of a number of figures included in the Royal Society report on Krakatoa (Symons, 1888) illustrating the progression of the pressure wave from the explosion site. The contours are reconstructed for every two hours starting at 04:00UTC (about one hour after the main explosion) on 27 August, 1883, with the earliest contour, labeled “4”, on the right. This is labeled the “first passage from Krakatoa to the antipodes.” The last contour shown in this plate is the con- tour near to and approaching the antipodal point at 20:00UTC on the left diagram, labeled “20”. An animation cov- ering the five-day period of detectable signals is discussed in the sidebar of this article.
to contract. As it moved toward the antipodal point, it would have collapsed to a point and re-emanated as if from a second- ary source at the antipodes. The cycle of propagation from Krakatoa to the antipodes and back would have continued until the amplitude decayed into the background of normal baro- metric fluctuations.
This is only roughly what happened. In reality, the circular wave front distorted as it traveled because the speed of propaga- tion varied along the route (See sidebar). Consider the contours at 36 and 38 hours from 00:00 GMT (33 and 35 hours from the main explosion) on 17 August (Fig. 3).
After almost a complete circuit around
the Earth, these contours show the
development of three distinct lobes. G.
I. Taylor (1929) succeeded in fitting the
three-lobed contour by assuming a
wind with direction parallel to latitude
lines and a speed that varied with lati-
tude. This assumed profile simulated
the expected easterly winds in the trop-
ics and westerly winds at middle lati-
tude. The fit, Acos3θ - Bcosθ where θ is
latitude, A = 7.6 m/s, and B = 3.7 m/s,
produced a maximum wind speed of
3.9 m/s from the east (at the equator)
and a maximum wind speed of 9.5 m/s
from the west (at 57 degrees latitude).
speed range also triggered an argu- ment. Some argued that the wave was an ordinary acoustic wave based on its speed; others rejected that notion because the frequency of the wave was so low and the wavelength so long. A popular view was that the wave in the atmosphere was similar to a long-peri- od surface wave on the ocean. In fact, the wave was neither a long-period surface wave nor a pure compression- al acoustic wave. The sound speed, the wind, and buoyancy all influenced the propagation; a reasonable theory would mature in the decade following the explosion.
Lord Rayleigh (1890) examined the nature of waves in an isothermal atmosphere having a density that decreased exponentially with altitude. Although Rayleigh does not mention Krakatoa in this paper, it is hard to believe that he was not influenced by the contemporary arguments about the observed propagation speed of the
Krakatoa wave. (However, Rayleigh did mention a perplexing issue related to wave propagation and natural frequencies in the atmosphere—the normal semi-diurnal component in baromet- ric pressure is far too large to attribute to tides in the atmos- phere. He proposed that a tidally driven resonance in the atmos- phere might be responsible.) Lamb (1911) extended the theory to include vertical variations in temperature.
The solutions of Rayleigh and Lamb accounted for both compressibility and buoyancy. They each explained that several wave types were possible and they connected the analytical solu-
 Roughly, the wave took a day and a half to make each complete circuit of the globe. The apparent speed of prop- agation3 ranged from 300 m/s to 325 m/s depending on the direction and inclination of the path. The observed
Fig. 3. The second in a series of seven figures showing the progression of the pressure wave. This figure shows the pro- gression after passing through the antipodal point and continuing back toward Krakatoa. The contour colors indicate the direction: red (Figure 2) toward the antipodal point; blue (above) back toward the explosion site. The last contour (labeled 38 for 38 hours after 00:00UTC on 27 August 1883) shows clearly the three-lobed pattern produced by unequal travel times along different paths.
The Krakatoa Volcano 15
