
Page 21 - Spring 2010
P. 21
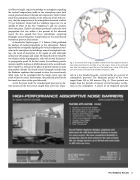
 Fig. 5. An estimate of the range of audible sound from the main explosion based on reports from land observers and ships at sea. The range is shown as the red shaded area. Note the elongation toward the west. The shaded area is about 1/13th of the area of the surface of the Earth. Re-drafted from Symons, 1888.
on effective height, require knowledge or assumption regarding the vertical temperature profile in the atmosphere since both sound speed and density depend on temperature. Taylor (1929) made the assumption common to the early part of the 20th cen- tury: that the temperature in the atmosphere decreased at about 5°C per kilometer (about half the “adiabatic lapse rate”) to an altitude of about 13 km (the “tropopause”) and was constant above that point. Taylor’s calculation produced a value for wave propagation that was within a few percent of the observed speed. He also argued that these calculations supported Rayleigh’s natural-frequency interpretation of the semi-diurnal barometric pressure fluctuations.
A decade after Taylor’s paper, C. L. Pekeris (1939) published his analysis of modal propagation in the atmosphere. Pekeris improved the assumption regarding the vertical temperature vari- ation in the atmosphere by including a zone of stratospheric heat- ing—the result of absorption in the region of solar ultraviolet interaction with oxygen and ozone. He found that there would be two distinct modes of propagation, each with its own characteris- tic propagation speed. In the first mode, the oscillatory particle motion would be in phase at all altitudes and, in the second mode, there would be a reversal in the phase of particle motion at some intermediate altitude. He found several barograph records from the Krakatoa explosion that seemed to show the second mode, albeit weak, but he concluded that the major events were the result of the first mode. Furthermore, the predicted speed for the first mode was close to the speed observed.
As for the pulse itself, the recorded peak pressures at dis- tant stations on the first circuit ranged from a few tens of pas-
cals to a few hundred pascals—several tenths of a percent of atmospheric pressure! The dominant period of the wave ranged from 100 to 200 minutes (Fig. 4). These periods are longer than the periods of typical vertical buoyancy oscilla- tions in the atmosphere. A parcel of air displaced upwards
 The Krakatoa Volcano 17
