
Page 40 - Summer 2010
P. 40
DOWNLOAD THE BANJO VIDEO CLIPS
Shortly after the print copy of this issue is mailed, it will also be published in the Acoustical Society of America's Digital Library. The Table of Contents may be reached directly by going to your internet browser and typing the following Uniform Resource Locator (URL) in the address block: http://scitation.aip.org/dbt/dbt.jsp? KEY=ATCODK&Volume=6&Issue=3. At some point in the download process you will probably be asked for your ID and Password if you are using a computer that is not networked to an institution with a subscription to the ASA Digital Library. These are the same username and password that you use as an ASA member to access the Journal of the Acoustical Society of America. Open the abstract for this article by clicking on Abstract. At the bottom of the abstract will be a link. Click on the link and a zipped folder (DickeyData.zip) will be down- loaded to your computer (wherever you usually receive downlinks). Unzip the entire folder (as a whole) and open the folder DickeyData. There are 4 files. Do not remove any files—simply open the file called DickeyOpenMe. It is an interactive pdf file. By clicking on any of the hyperlink clips in this file, you should see the video clip associated with that link. The video clip was recorded in QuickTime's .MOV format. If you have difficulty in playing it, you might download the PC or MAC version of VLC Media Player from www.videolan.org. This is a non-profit organization that has created a very powerful, cross-platform, free and open source player that works with almost all video and audio formats. Questions? Email the Scitation Help Desk at help@scitation.org or call 1-800-874-6383.
plexity of a pulse reverberating in a circular membrane. In other cases, it allows one to play the “what if ” game by adjust- ing parameters with just a few keystrokes. A word of caution here; the “what if” game, while illuminating, can be very irk- some to experimentalists who are constrained to real-world materials. Admittedly, the many approximations which go into this and most modeling, mean that analytical models can never be exact. The process is, however, often useful to predict if a proposed change is leading you where you want to go.
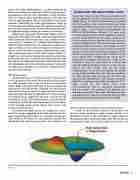
Replacing the short pulse with a more realistic excitation imparted to the head by the string, we get head displacements which look quite different and are, in fact, similar to meas- ured results. A snapshot of a calculated head displacement while the head is being driven by a damped sinusoidal oscil- lation is shown in Fig. 4. Here the frequency of the drive is close to one of the natural resonance frequencies of the head. The accompanying movie of the head response [Movie 3- LongPulse] covers only a fraction of a second in actual time. During this time you can observe the head excitation build for a few tens of milliseconds and then slowly diminish as the drive diminishes and the head dissipates energy. Calculations also allow one to compare the energy lost to material damp- ing and sound radiation.
The head tension
Another advantage of studying the banjo is that many of its set-up parameters are easily adjusted and many of its parts are easily replaced. This is one reason that so many banjo players fiddle with their banjo! One of the most influential parameters is the head tension. Although I do not do much experimental work any more, I do appreciate the need for it and particularly the need for “ground truth” when modeling. So I took my banjo, tapped the head with a screwdriver, and recorded the sound. This “delta function” excitation should, in principle, excite all the head modes and a spectral analysis of the recorded sound should display these modes. The results are shown in Fig. 5.
To calculate the modal response for comparison, I calcu- lated the average magnitude of the head response for har- monic (single frequency) drives as a function of frequency. This would not be exactly the same quantity measured but should show the same frequency peaks. The comparison of
measured peaks and calculated ones are shown in Fig. 5.
I could not find tabulated values for the flexural wave speed in mylar membranes under various tensions, so I adjusted the tension in the calculation (a single number in the computer code) until the first peak at 295 Hz matched the measured one; voila, all the other peaks lined up! Also, the
Fig. 4. The highly exaggerated deflection of the head when driven at the bridge position by a damped, sinusoidal force. The frequency of the sinusoid is near a resonance of the head.
The Banjo 39
