
Page 41 - Summer 2010
P. 41
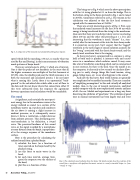
  Fig. 5. A comparison of the measured and calculated head frequency response.
 This brings us to Fig. 6 which uses the above prescription with the 1st string plucked at 0.1 m from the bridge. This is the bottom string in the banjo pictured in Fig. 1 and is tuned to 293 Hz. (sometimes referred to as D4). The tension in the calculation was adjusted so that the first head resonance
5
that radiated sound increases for the first 30 to 40 ms while energy is being transferred from the string to the membrane. Also note that there are two distinct decay curves: one lasting about 200 ms and the other still persisting at 1 s. It is also interesting that the waveform is much “cleaner” (i.e., sinu- soidal) after the instrument settles into the slow decay mode. It is conjecture on my part, but I suspect that the “ragged” waveform in the early stages of sound radiation accounts for the “twang” associated with the classic banjo sound, and the nearly tonal waveform later is the ringing.
So there you have it, summarized in a sentence: a string held at both ends is plucked, it interacts with and causes waves in a membrane which radiates sound. It may seem like a lot of trouble for something which can be summarized in one sentence, but here is the deal. Once the model is on the computer, it takes only a few seconds to calculate allow- ing you to easily change things like head tension, string gauge, bridge mass, etc. to see what happens to the sound.
And now the bad news. Real world systems are generally too complicated to be modeled accurately. There are a number of “simplifying assumptions” in this and virtually all analytical models. Also, in the case of musical instruments, analytical models compete with the most sophisticated acoustic analyzer of all—the ear. Models and experiments are a long way from discerning the subtleties of “good tone.” The evolution of good tone in musical instruments has been largely trial and error
agreed with the measured one at 295 Hz.
There are several interesting aspects of Fig. 6. First, note
 speed which did the matching, 150 m/s, is exactly what was used by Rae and Rossing3 in their measurements of vibration
4
One is that the peaks are not harmonic in the sense that all the higher resonances are multiples of the first harmonic at 295 Hz. Also, the double peak near the third resonance is in both the measured and calculated spectra. I do not know what is causing this. Lastly, there is an exponential “back- ground” in the calculated data which adds a sort of floor to the data and I do not know where that comes from either. If this were subtracted from the response the agreement between experiment and calculation would be remarkable.
The sound
A significant, and certainly the most perti- nent energy loss to the membrane waves is the energy radiated as sound. As a section of the membrane moves up, it pushes and condenses the air above it causing a slight increase in ambient pressure; as it subsequently moves down, it forms a rarefaction, a slight decrease from ambient pressure. This alternating pres- sure/rarefaction is, by definition, a sound wave. The perceived loudness of this sound wave, or the signal recorded by a microphone at some distance from the banjo, is proportion- al to the average response of the membrane surface.
Here is the procedure for calculating the radiated sound from a plucked banjo:
1) calculate the force (as a function of time) exerted on the banjo head by the plucked string,
2) use this force to excite waves in the head,
3) for each time interval, average (inte- grate) the response over the surface of the head,
4) plot this as a function of time.
mode patterns of banjo heads.
There are several aspects of Fig. 5 which are of interest.
  Fig. 6. The calculated sound radiation from the banjo. The detail excerpts show the evolution of the sound from a waveform with significant harmonic content to a nearly sinusoidal shape; i.e., from “twang” to “ring.”
40 Acoustics Today, July 2010
